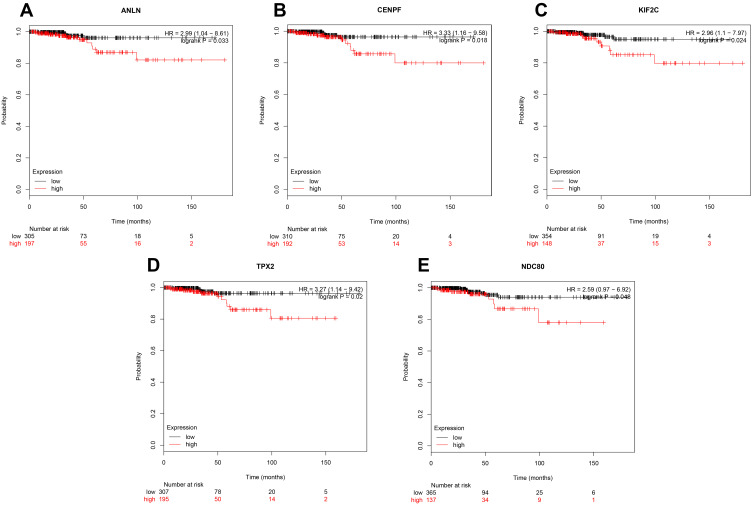
Figure 4.
The prognostic curve of five genes. The prognostic significance of the hub genes in patients with TC, according to the Kaplan–Meier plotter database. (A) ANLN; (B) CENPF; (C) KIF2C; (D) TPX2; (E) NDC80. The red lines denote patients with high gene expression, and black lines denote patients with low gene expression.

