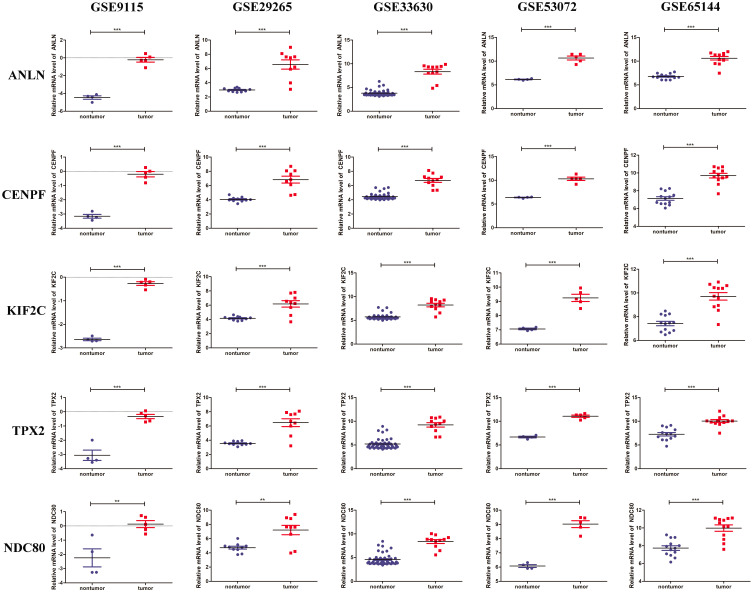
Figure 5.
The mRNA expression of the five genes in five microarray datasets. The mRNA expressions of ANLN, CENPF, KIF2C, TPX2 and NDC80 in five microarray datasets (GSE9115, GSE29265, GSE33630, GSE53072, and GSE65144) respectively. The red dots represent a high gene expression, and blue dots represent a low gene expression. ** P < 0.01, *** P < 0.001 vs nontumor.

