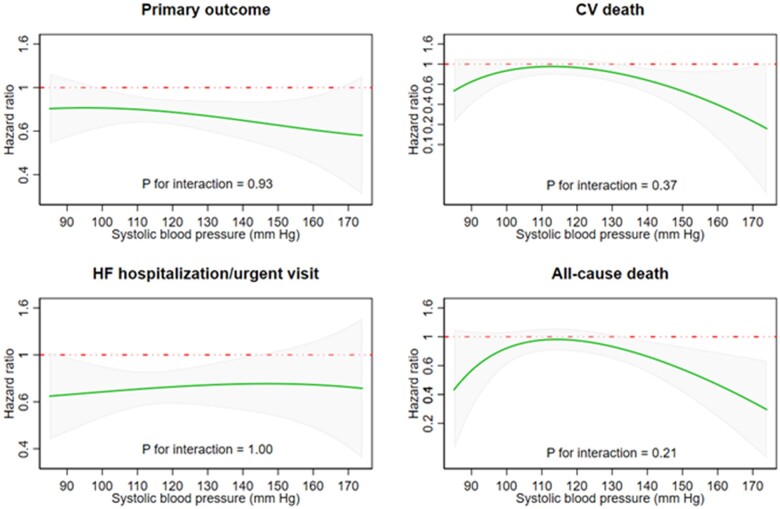
Figure 4.
Hazard ratio for dapagliflozin, compared with placebo, for each clinical outcome, according to baseline systolic blood pressure modelled as a continuous variable. The figures show a continuous hazard ratio (green line) for treatment with dapagliflozin, compared to placebo, according to baseline systolic blood pressure. The interrupted red line shows a hazard ratio of 1 (i.e. unity, representing no treatment effect) and the grey shaded area the 95% confidence interval around the hazard ratio.

