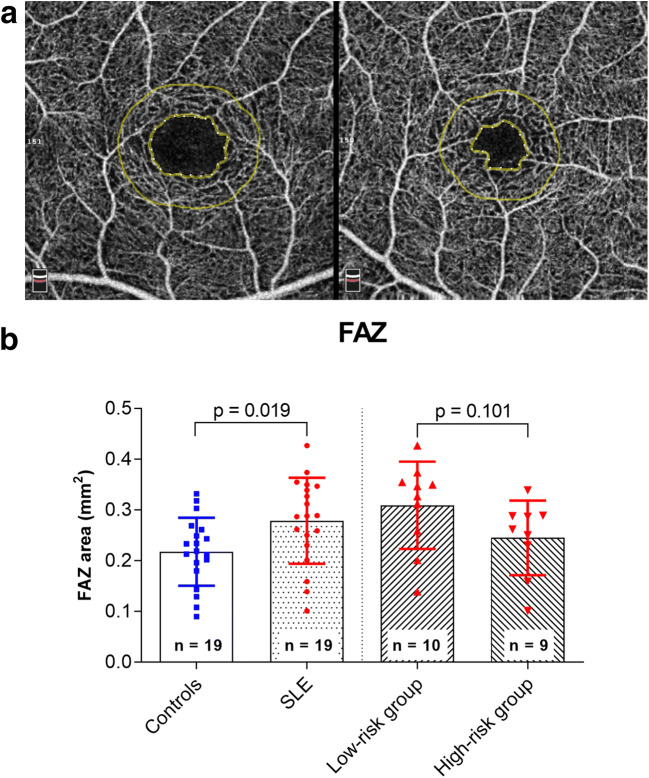
Fig. 4.
a Exemplary color-coded superficial capillary plexus optical coherence tomography (OCT) angiogram (3 × 3 mm) showing the foveal avascular zone (FAZ) measurements of a patient with systemic lupus erythematosus (SLE) treated with hydroxychloroquine (HCQ) for 2 months (left) and a healthy control (right). b Comparison of the FAZ area between the study and control group as well as between patients treated with HCQ for < 5 years (low-risk group) and > 5 years (high-risk group)

