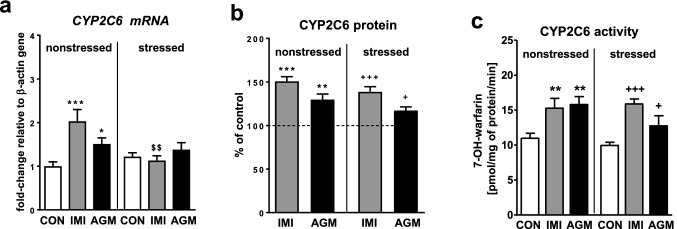
Fig. 4.
The influence of a 5-week treatment with imipramine or agomelatine on the expression and activity of CYP2C6 in the liver from the chronic mild stress (CMS) model. a The mRNA expression level of CYP2C6. Results are expressed as the fold-change in relation to the housekeeping gene β-actin (n = 6), the outcome of two-way ANOVA is shown in Table 1; b CYP2C6 protein level (n = 6), the outcome of one-way ANOVA is shown in Table 2; c CYP2C6 activity measured as a rate of warfarin 7-hydroxylation (n = 9–10), the outcome of two-way ANOVA is shown in Table 3. Results are shown as the means ± S.E.M. Duncan’s test: statistical significance is shown as *p < 0.05, **p < 0.01, ***p < 0.001 compared to the nonstressed control; +p < 0.05, + + +p < 0.001 compared to the stressed control; $$p < 0.01 compared to the nonstressed imipramine-treated rats. The representative CYP2C6 protein bands of the Western immunoblot analysis are shown in Fig. 8. CON control, IMI imipramine, AGM agomelatine

