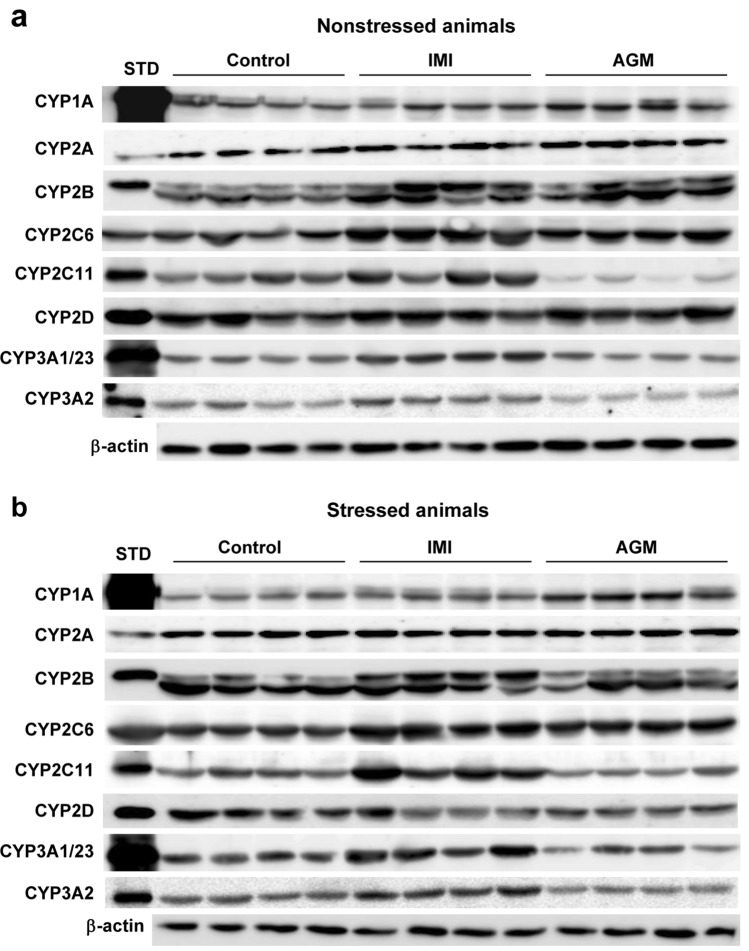
Fig. 8.
The effect of a 5-week treatment with imipramine or agomelatine on the intensity of protein bands of cytochrome P450 enzymes (CYP1A, CYP2A, CYP2B, CYP2C6 CYP2C11, CYP2D and CYP3A) in rat liver microsomes from nonstressed (a) and stressed (b) rats. Microsomal proteins were subjected to the Western immunoblot analysis. cDNA-expressed CYP enzymes were used as standards. The representative CYP protein bands in imipramine- or agomelatine-treated rats are shown. The presented results are typical of four separate rats per group. The mean values ± S.E.M. are shown in Figs. 1b, 2b, 3b, 4b, 5b, 6b and 7b. IMI imipramine, AGM agomelatine, STD standard

