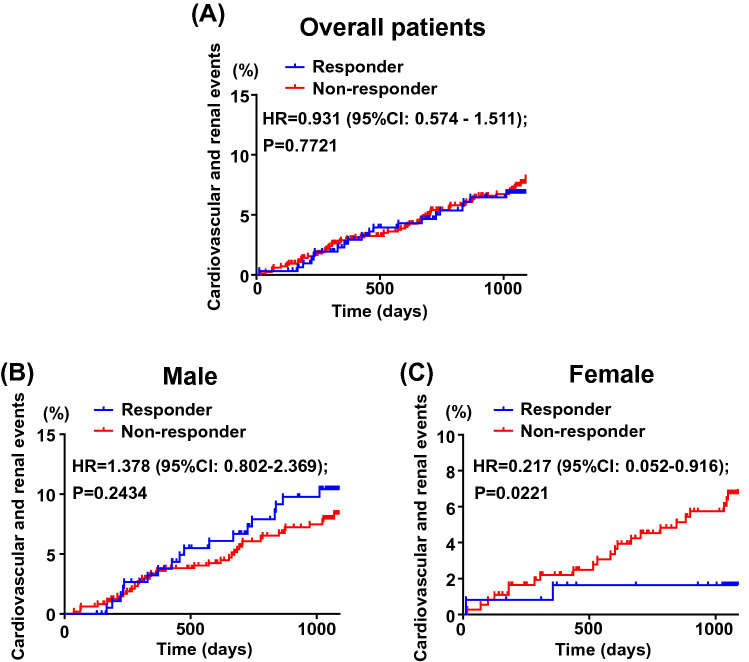
Figure 2.
Kaplan–Meier curves for composite cardiovascular and renal events in responder group and non-responder group for overall patients (A), male (B) and female (C). In overall patients (A), there was 22 and 64 events in responder group (n = 315) and non-responder group (n = 847). In male (B), there was 20 and 38 events in responder group (n = 192) and non-responder group (n = 480), respectively. In female (C), there were 2 and 26 events in responder group (n = 123) and non-responder group (n = 367), respectively. Abbreviations used are the same as in Fig. 1.

