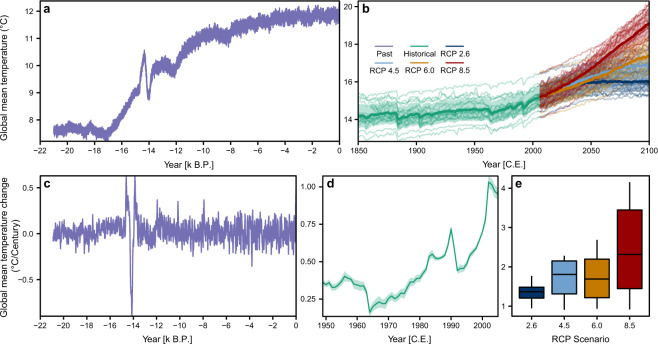
Fig. 2.
Annual global mean temperature and trend in global mean temperature from the Last Glacial Maximum to the end of the 21st century. The Global mean temperature during the past as simulated by TraCE-21ka (a), and spliced historical/future climate simulations to 2100 (b). Trends in global mean temperature for past (c), historical to 2005 (d), and for the future under four different RCP scenarios (e). The individual lines in b show the multi-realisation model averages, with the bolder lines showing the multi-model ensemble average for the respective scenario. The shaded areas in b and d show the multi-model variability in global mean temperatures and trend estimates (±1 S.D.). The timesteps in c and d, show the end-year of the century window (e.g. 1950 = window from 1851:1950 C.E.). Values in e show slopes for 2006 to 2100 C.E. Note that the y-axis differs between all plots.

