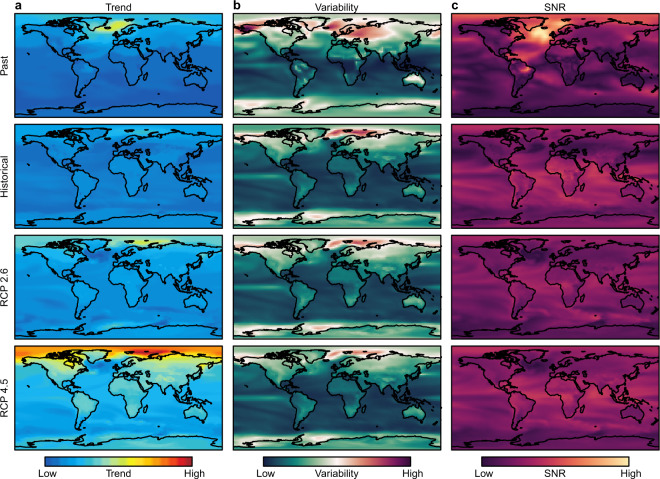
Fig. 3.
Maps of trend, variability, and signal to noise ratio (SNR) for temperature during periods of extreme global warming in the ocean and on land (≥90th percentile from pre-industrial conditions). Maps of centennial trend (a), inter-annual variability (b), and SNR (c). Rows represent rapid global warming events at different time periods/climate scenarios. Past = Bølling–Allerød (14.7-14.2k B.P.69); Historical = 1850 C.E.–2005 C.E.; RCP 2.6 & 4.5 = Representative Concentration Pathways 2.6 and 4.5 for 2001 C.E.–2100 C.E. Maps of the past and historical conditions are mean estimates for overlapping century windows during the relevant periods.

