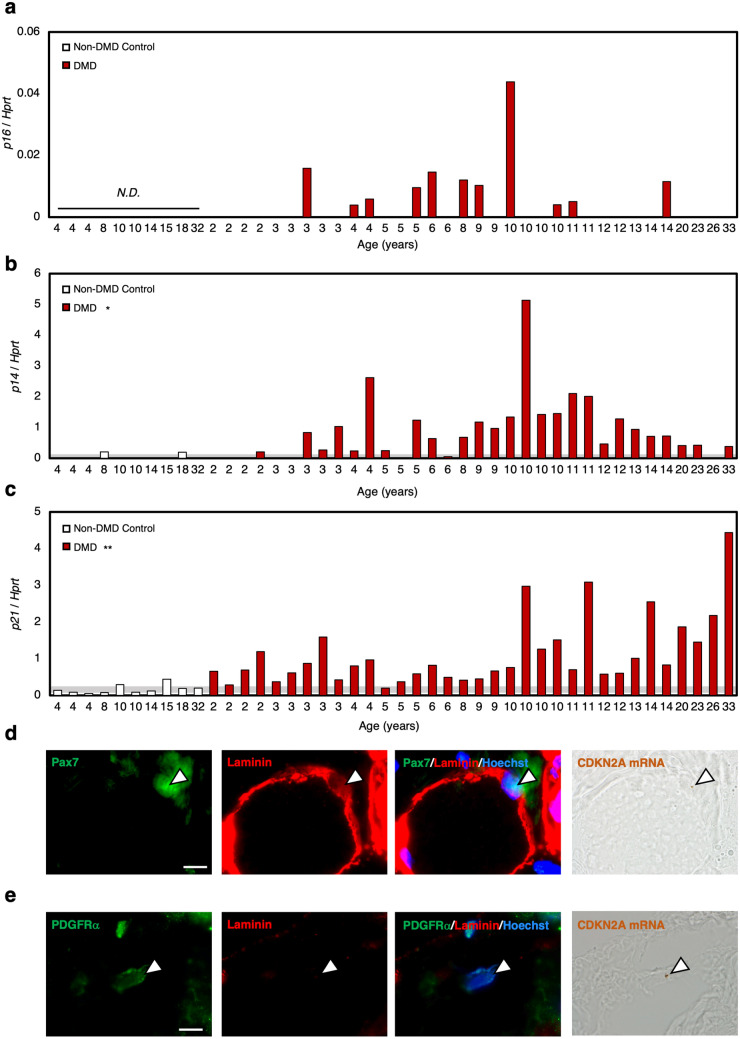
Figure 5.
Senescence markers were elevated in human DMD patients. (a–c) Quantification of mRNA levels of senescence markers (p16, p14, and p21) in non-DMD control individuals and patients with DMD. Individual data from non-DMD control individuals and DMD patients are expressed as bar graphs (n = 10, 35). The grey band behind the graph indicates the mean ± SEM value range of the non-DMD control group. The figure without a grey band indicate that the target gene expression was not observed in the non-DMD control group. (d,e) Skeletal muscle sections from DMD patients were subjected to in situ hybridisation of CDKN2A mRNA using RNAscope before immunocytochemical analysis of (d) Pax7 or (e) PDGFRα with laminin. CDKN2A mRNA appears as brown dots. Scale bar = 10 μm. White arrowheads indicate DAB signal. N.D. not detected.

