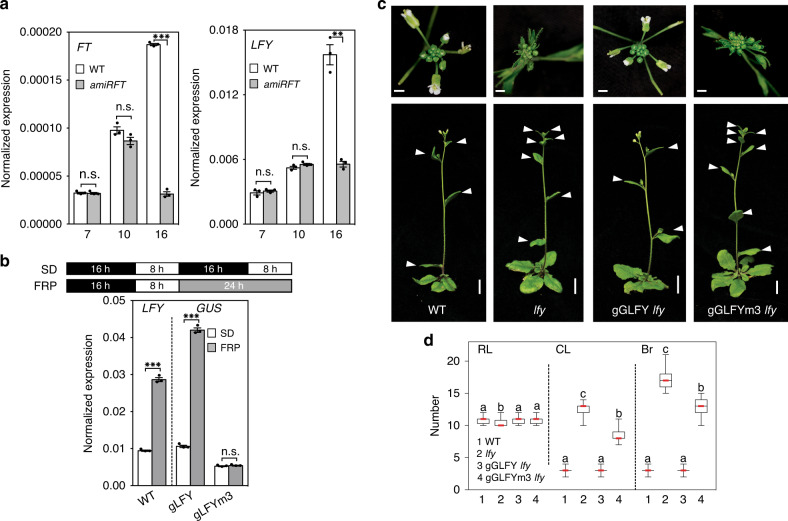
Fig. 3. FT upregulates LFY expression to promote floral fate.
a Expression of FT and LFY in above-ground tissues of long-day-grown wild-type (WT) and pFT4kb:amiRFT plants prior to onset of (day 7 and day 10) or during (day 16) reproductive development. b Effect of a single far-red enriched photoperiod (FRP) on LFY (left) and reporter (GUS, right) accumulation in 42-day-old short day (SD) grown plants. a, b Expression was normalized over UBQ10. Shown are mean ± SEM of three independent biological experiments (black dots). Unpaired one-tailed t-test; p values: n.s. FT day 7 = 0.407, n.s. FT day 10 = 0.052, ***FT day 16 = 6E−05; n.s. LFY day 7 = 0.258, n.s. LFY day 10 = 0.07, **LFY day 16 = 0.0045 (a) ***LFY WT ± FRP = 0.0004, ***gLFY-GUS ± FRP = 0.0001, n.s. gLFY-GUSm3 ± FRP = 0.217 (b). c Rescue of lfy-1 null mutants by genomic GFP-tagged LFY (gGLFY) or a bZIP-binding site mutated version thereof (gGLFYm3) in long-day-grown plants. Representative inflorescence images (top and side view). Arrowheads indicate branches formed on the main stem. For m3 mutations see Fig. 2a. d Phenotype quantification of 15 independent transgenic lines for gGLFY lfy and gGLFYm3 lfy. RL rosette leaves, CL cauline leaves, Br branches. Box plot-median (red line), upper and lower quartiles (box edges), and minima and maxima (whiskers). Letters: significantly different groups p value < 0.05 based on Kruskal–Wallis test with Dunn’s post hoc test. Scale bars, 1 cm. See also Supplementary Figs. 6–10.

