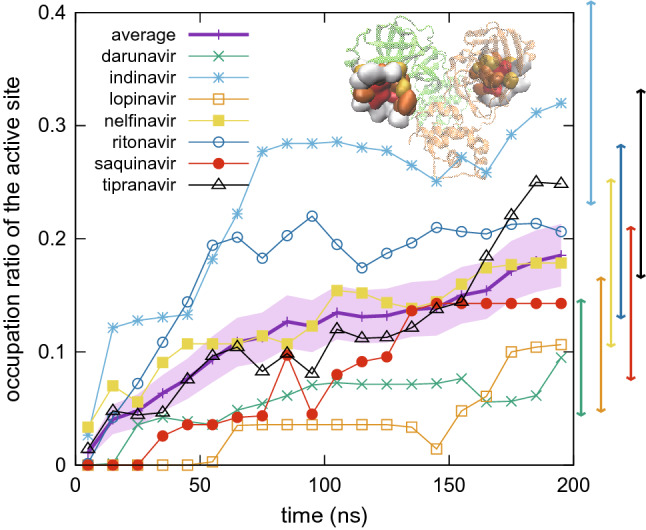
Figure 3.

Time course of occupation ratio at the active site. The figure shows mean occupation ratio averaged in a time span of every 10 ns over 28 trajectories for each ligand. The average over seven ligands is also shown with thicker line (standard error with shaded area). Standard error for final 10 ns of each ligand is shown at the right side of the graph (see Supplementary F for the estimation of errors). Inset shows the active site residues (see Supplementary Fig. D1). Occupation ratios for the other sites are shown in Supplementary Fig. F1.
