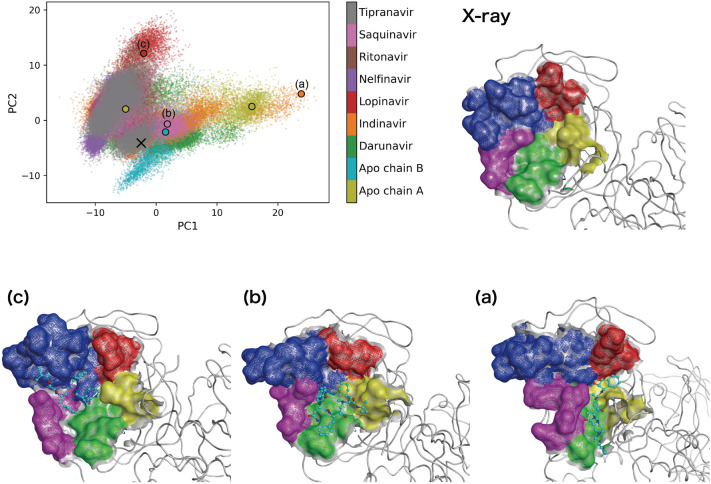
Figure 4.
Conformational diversity of the Mpro active site. The projection of the first two principal components (PC1 and PC2) is shown. The contribution ratios of first two principal components (PC1 and PC2) were 36.1% and 12.9%, respectively. The conformations of the active site, corresponding to the cross mark and (a)–(c) in the projection, are shown: the cross mark and (a)–(c) are the crystal structure (PDB ID: 6LU7) and simulation structures of indinavir-bound Mpro, saquinavir-bound Mpro, and lopinavir-bound Mpro systems, respectively. The five regions of the active site, (1) residues 24–27, (2) 41–54, (3) 140–145, (4) 163–168 and 172, and (5) 187–192, are coloured in red, blue, yellow, green, and magenta, respectively. The representative conformations for the active site of apo-Mpro system are shown in Supplementary Fig. J3. The Apo chain A and Apo chain B correspond to the trajectories of the active sites of the chain A and the chain B of the apo-Mpro system, respectively.

