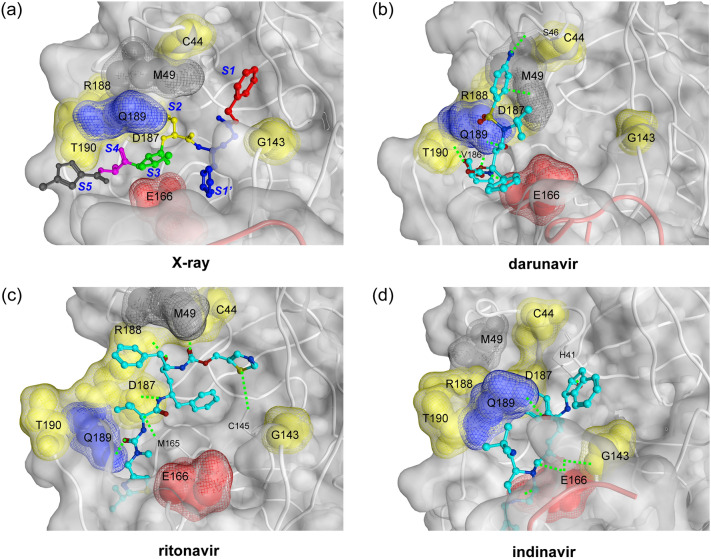
Figure 5.
Key active site residues for ligand binding. (a) The key amino acids were determined with the representative appearance rate of the interaction fingerprints (RAIF) and are highlighted with space-filling models in red (Glu166), blue (Gln189), yellow (Cys44, Gly143, Asp187, Arg188, and Thr190), and grey (Met49). First two residues, Glu166 and Gln189, were commonly utilised for multiple ligands, while others for single ligand (see main text and Supplementary Table K1). This figure is depicted on the crystal structure of Mpro-N3 inhibitor complex (PDB ID: 6LU7). The P1′, P1, P2, P3, P4, and P5 residues of N3 inhibitor is shown with ball and stick models in red (P1′), blue (P1), yellow (P2), green (P3), magenta (P4), and grey (P5), and the S1′, S1, S2, S3, S4, and S5 indicate the subsites corresponding to P1′–P5 sites of N3 inhibitor3. (b) The representative binding pose of darunavir-bound Mpro system is shown. The ligand interacted with Ser46, Met49, Glu166, Val186, Gln189, and Thr190. (c) The representative binding pose of ritonavir bound Mpro system is shown. The ligand interacted with Cys44, Cys145, Met165, Asp187, Arg188, and Gln189. (d) The representative binding pose of indinavir-bound Mpro system is shown. The ligand interacted with His41, Gly143, Glu166, and Gln189. In (b)–(d) structures, the detected hydrogen bonds (Supplementary information K) are shown with green dotted lines. The ligands are shown with ball and stick models.

