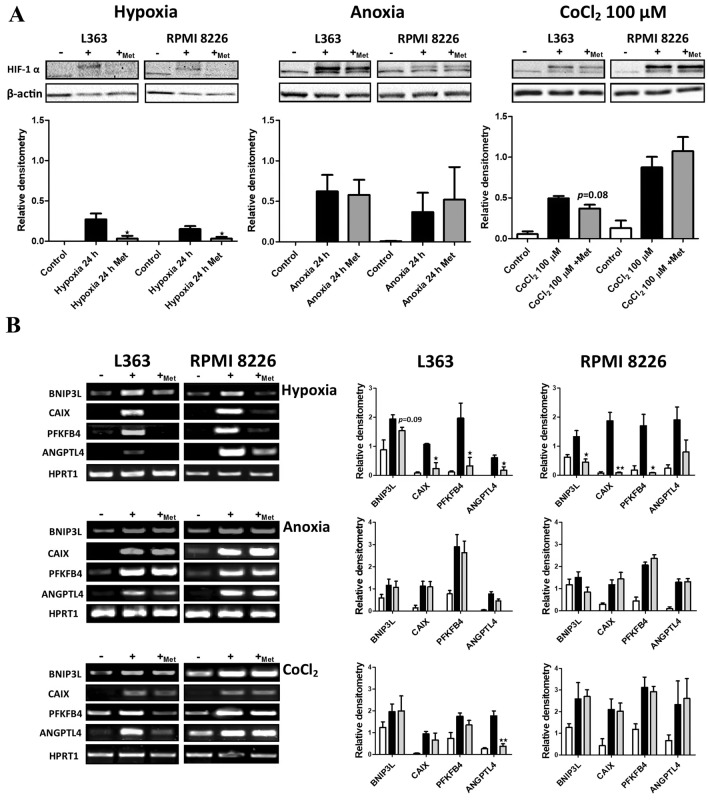
Fig. 1.
Influence of metformin on HIF-1 pathway activation induced by hypoxia, anoxia and cobalt chloride. a Influence of metformin on HIF-1 alpha stabilization. Upper panel: Multiple Myeloma cell lines were cultured for 24 h in different conditions in the presence and absence of metformin (5 mM) and subsequently HIF-1 alpha subunits accumulation was verified using the Western Blot. β-actin is shown as an internal control for equal loading. Lower panels: densitometry analysis of Western blot bands intensity normalized to β-actin. Each relative densitometry value is the average from three independent experiments. The mean ± SEM is shown. Student t test was used to evaluate influence of metformin on HIF-1 alpha stabilization. *p < 0.05 by student’s t test, p value between 0.05 and 0.1, by student’s t test was given as an indication of the trend. In all presented Western blot 30 µg of protein lysate was applied. b Influence of metformin on HIF-1 transcriptional response. Left panel: multiple myeloma cell lines, L363 and RPMI 8226, were cultured for 24 h in different conditions in the presence and absence of metformin (5 mM) and the influence of metformin on HIF-1 transcriptional response was assessed by RT-PCR. HPRT1 was used as an internal control for equal loading. Right panel: densitometry analysis of RT-PCR bands intensity normalized to HPRT1. Each relative densitometry value is the average from three independent experiments. The mean ± SEM is shown. Student t test was used to evaluate influence of metformin on HIF-1 triggered gene expression. *p < 0.05 by student’s t test, **p < 0.01 by student’s t test, p value between 0.05 and 0.1, by student’s t test, was given as an indication of the trend

