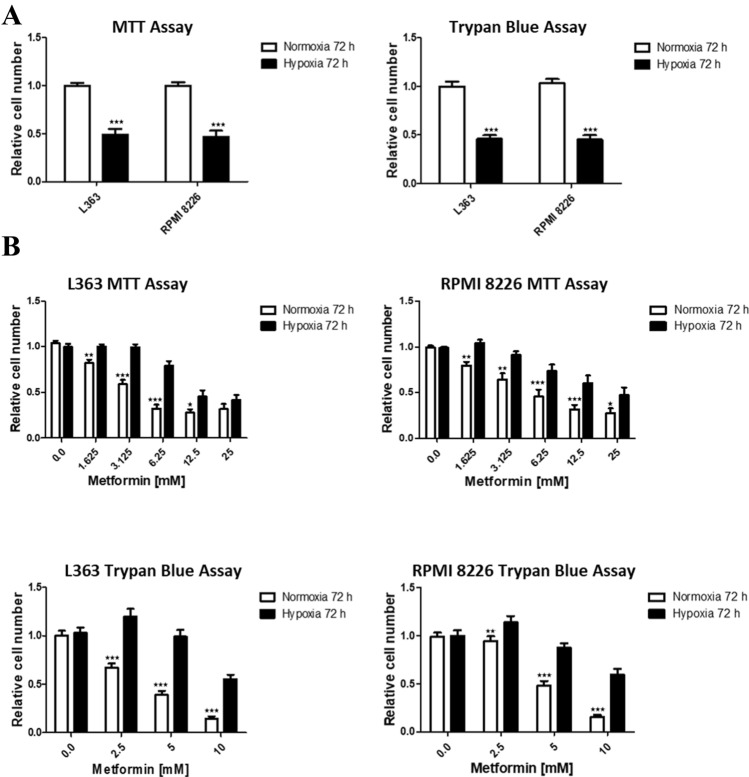
Fig. 4.
Influence of metformin on growth of multiple myeloma cells in hypoxic and normoxic conditions. a The influence of hypoxia on the growth of multiple myeloma cells. MM cell lines, RPMI 8226 and L363, were cultured in normoxic and hypoxic conditions for 72 h. Left panel: the absorbance of normoxic cells was normalized to 1 and subsequently the absorbance of hypoxic ones was normalized to this value. Right panel: the number of cell in normoxic conditions was normalized to 1 and subsequently the number of hypoxic ones was normalized to this value. The mean ± SEM of at least three independent experiments is shown. Student t test was used to evaluate the differences between the cell growth in normoxic and hypoxic conditions ***p < 0.001 by student’s t test. b The influence of the range of metformin concentration on the multiple myeloma growth in normoxic and hypoxic conditions. MM cell lines, RPMI 8226 and L363, were cultured in normoxic and hypoxic conditions with the range of metformin concentrations for 72 h. Upper panel: the absorbance of normoxic and hypoxic cells cultured without the presence of metformin was normalized to 1 and subsequently the absorbance of normoxic and hypoxic cells treated with metformin was normalized to its corresponding value. Lower panel: the number of normoxic and hypoxic cells cultured without the presence of metformin was normalized to 1 and subsequently the number of normoxic and hypoxic cells treated with metformin was normalized to its corresponding value. The mean ± SEM of at least three independent experiments is shown. Multiway ANOVA was used to evaluate the influence of hypoxia and metformin on L363 and RPMI 8226 cells. The significant differences in response to metformin between hypoxic and normoxic cells are indicated on the graph (by multiway ANOVA with Fisher’s least significant difference (LSD) posthoc test). *p < 0.05, **p < 0.01, ***p < 0.001

