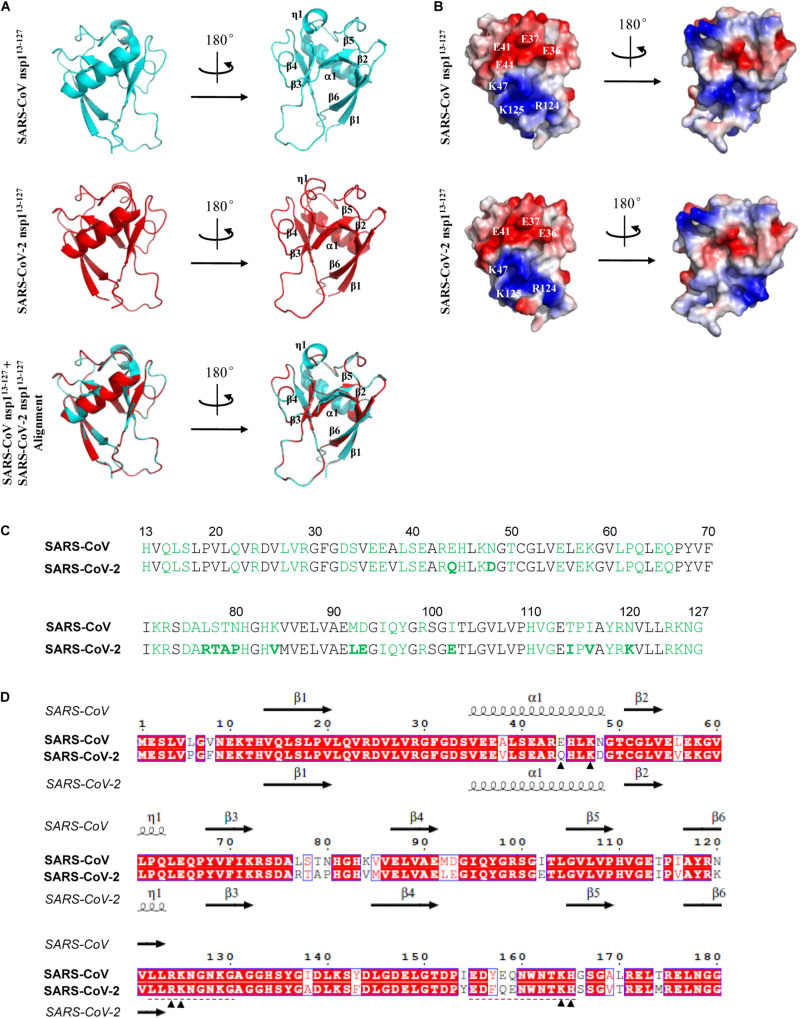
FIGURE 4.
Predicted structure features of SARS-CoV-2 nsp1. (A) Ribbon models of the SARS-CoV and SARS-CoV-2 nsp1 structures. The determined NMR structure of SARS-CoV nsp113– 127 (residues 13–127) was downloaded from Protein Data Bank (PDB code: 2HSX) as shown in cycan. The structural modeling of SARS-CoV-2 nsp113– 127 was conducted by target-template alignment using SWISS-MODEL server with the structure of SARS-CoV nsp113– 127 as template. Visualization of structural details and alignment of the two structures (cyan overlapping red) were performed by PyMOL software. The RMSD value between the predicted SARS-CoV-2 nsp113– 127 and SARS-CoV nsp113– 127 structures is 0.087 Å. The organization of the main secondary structures is indicated in a selected rotation. (B) Solid surface views of the SARS-CoV nsp113– 127 and predicted SARS-CoV-2 nsp113– 127 structures. These models have the same orientations as in panel (A). Red represents negatively charged; blue represents positively charged. Some key surface residues in the large areas of negative or positive charges are indicated. (C) Solvent-exposed residues of SARS-CoV and SARS-CoV-2 nsp1 proteins are highlighted in green. Those in boldface represent a few differences between SARS-CoV and SARS-CoV-2 nsp1. (D) Comparison of aa sequences and secondary elements between SARS-CoV and SARS-CoV-2 nsp1. Sequence alignment was conducted using Clustal X and visualized by ESPript. The main secondary structures of SARS-CoV and SARS-CoV-2 nsp1 are displayed above and below the sequences, respectively. The secondary structures of SARS-CoV-2 were predicted by SWISS-MODEL server as described in panel (A). Note that some predicted secondary structures exhibit subtle differences with those analyzed in PyMOL. Several aa sites discussed in the text were indicated with arrowheads. Two regions involved in the studies of attenuated vaccines were underlined with red dashed lines.

