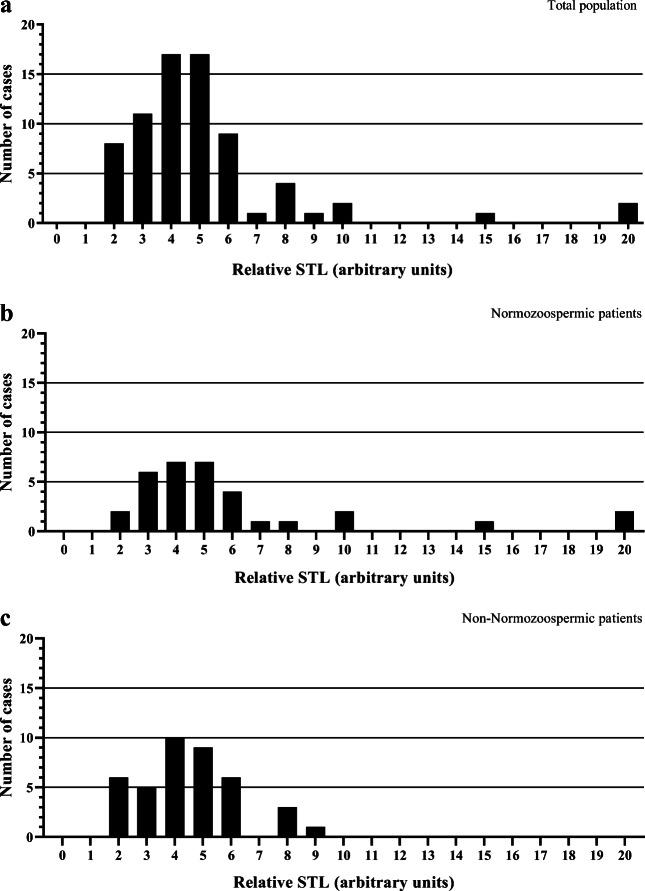
Fig. 1.
Frequency distribution histograms of relative sperm telomere length (STL) in the study population. a Total population (n = 73), with a relative STL of 5.22 ± 3.26 (1.65–19.67). b Normozoospermic patients (n = 33), with relative STL of 6.10 ± 4.36 (1.80–19.67). c Non-normozoospermic patients (n = 40), with relative STL of 4.54 ± 1.74 (1.65–8.87)

