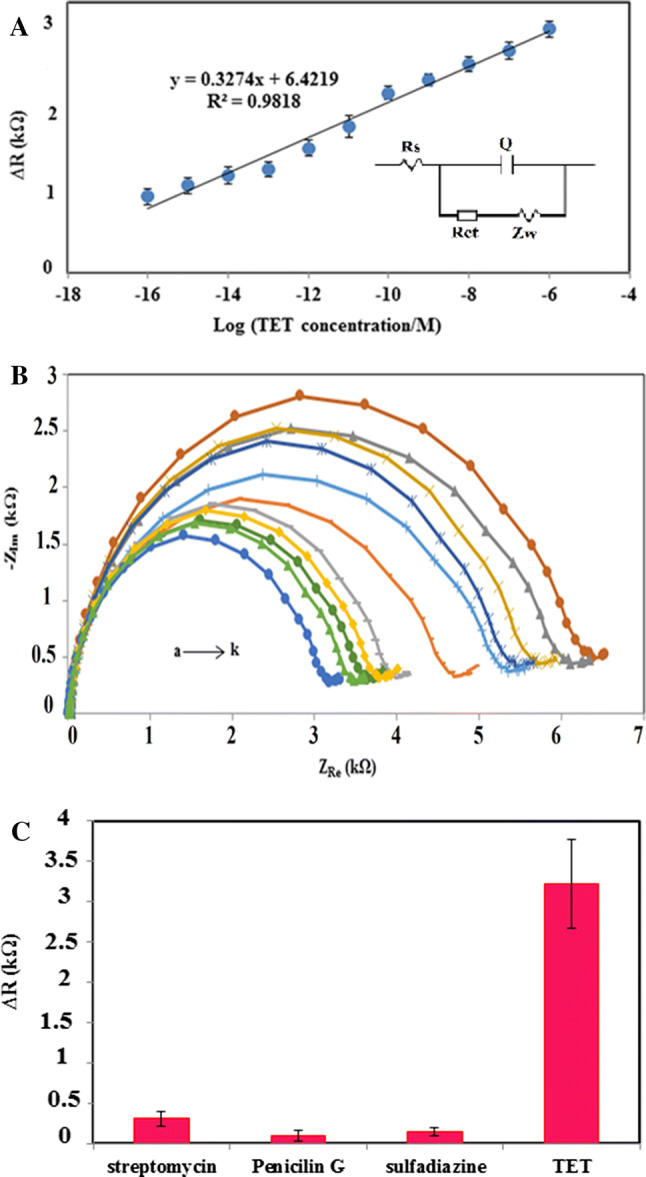
Fig. 4.

a calibration plot for ΔRct versus Log concentration of TET, b Nyquist diagram for different concentration of TET, (a-k) 1.0 × 10⁻¹⁶, 1.0 × 10⁻¹⁵, 1.0 × 10⁻¹⁴, 1.0 × 10⁻¹³, 1.0 × 10⁻¹², 1.0 × 10⁻¹¹, 1.0 × 10⁻¹⁰, 1.0 × 10⁻⁹, 1.0 × 10⁻⁸, 1.0 × 10⁻⁷, 1.0 × 10⁻⁶ M, respectively. In 5.0 mM Fe(CN)64−/3− containing 0.1 M KCl solution, The error bars represented the standard deviation (SD) (n = 3), c Selectivity of the fabricated aptasensor (n = 3) with streptomycin, penicillin G and sulfadiazine instead of TET, at the same concentrations (1 × 10⁻⁹ M). The error bars represented the SD (n = three electrodes)
