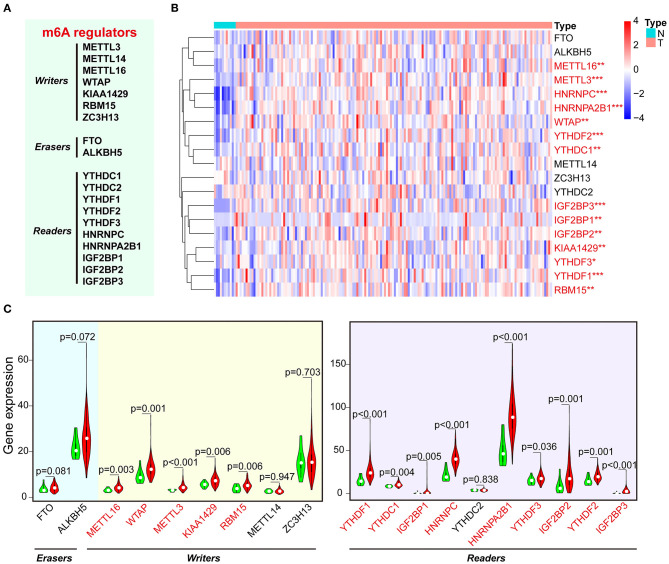
Figure 1.
The expression of m6A-related regulators in ESCA and normal control samples of TCGA. (A) The list of m6A RNA methylation–related writers, erasers, and readers. (B) The expression levels of 19 m6A-related genes in ESCA were displayed via heatmap. N, non-tumor tissues; T, tumor tissues. (C) Vioplot visualizing the expression of m6A-related genes in ESCA. Green color represents non-tumor tissues, and the red color represents tumor tissues. *P < 0.05, **P < 0.01, and ***P < 0.001.

