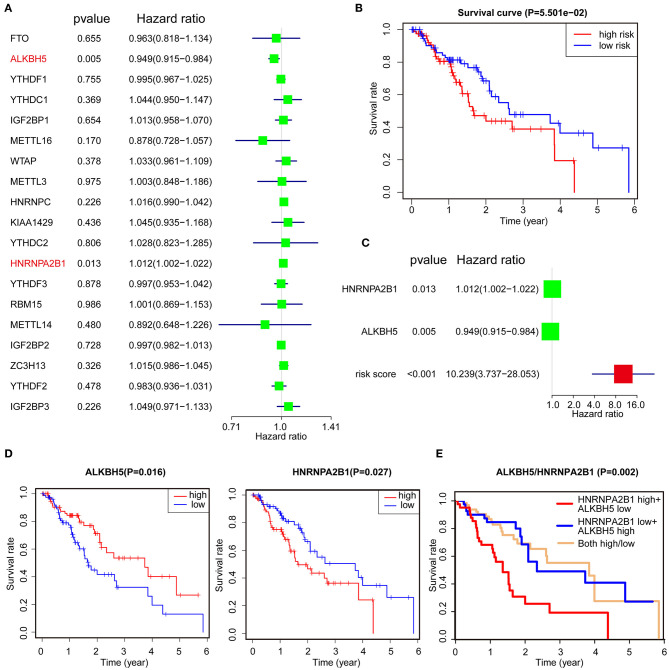
Figure 2.
Identification of prognostic signature among m6A regulators. (A) Identification of the m6A-related genes that significantly correlated with OS via univariate analysis. (B) Kaplan–Meier OS curves for ESCA patients assigned to high- and low-risk groups. (C) The risk signature of ALKBH5 + HNRNPA2B1 is more reliable for OS prognosis via univariate analysis. (D,E) Kaplan–Meier curves depicting OS according to the expression ALKBH5 or HNRNPA2B1 (D) and combined with ALKBH5/HNRNPA2B1 (E) based on TCGA data.

