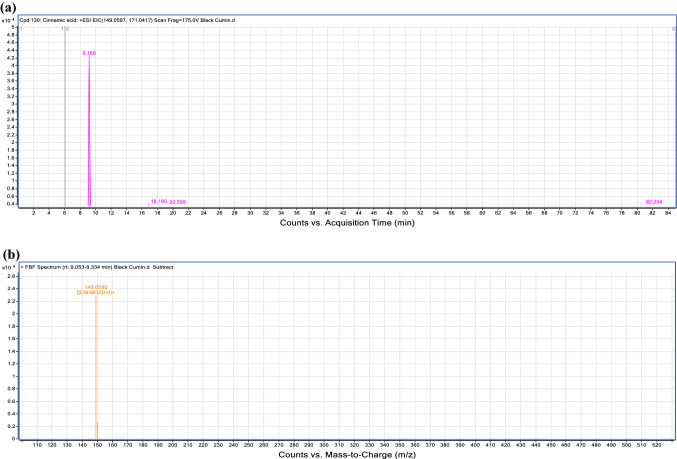
Fig. 1.
Extracted ion chromatogram and their mass spectrum. a A chromatograph of cinnamic acid (Compound 1, Table 2), Retention time (RT = 9.169 min) in the positive mode of ionization (ESI+/[M + H]+) tentatively identified only in black cumin; b mass spectra of cinnamic acid showing an observed m/z 149.0590

