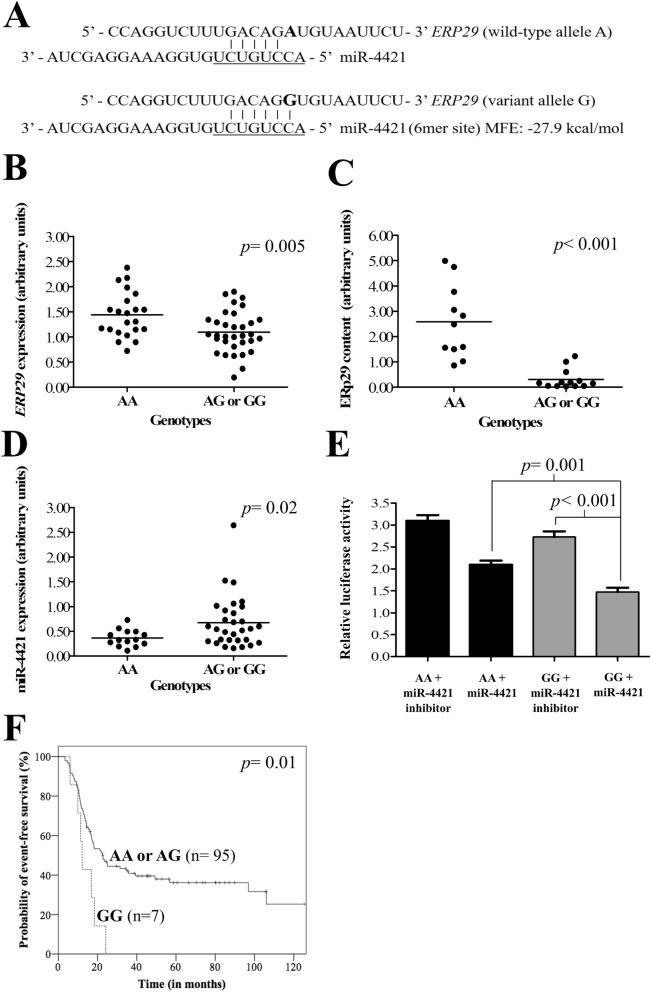
Figure 1.
ERP29 rs7114 single nucleotide variation (SNV) modulated gene expression and protein content, possible due to miR-4421 affinity. (A) Predicted microRNA (miRNA) miR-4421 binding site in ERP29 3′-unstranslated region (3′-UTR) related to rs7114 SNV. The miRNA “seed” region is presented in underline font. The rs7114 SNV of ERP29 is represented in bold letter. The variant allele G creates a binding site of six nucleotides (6mer site) to miR-4421. The wild-type allele A disrupts the binding site. (B) ERP29 rs7114 genotypes and gene expression. The mean mRNA expression level was lower in individuals with ERP29 AG or GG (p = 0.005) when compared with the AA genotype. (C) ERP29 rs7114 genotypes and protein level by Western blotting. The ERp29 protein content was lower in individuals with ERP29 AG or GG genotypes (p < 0.001) when compared with the AA genotype. (D) ERP29 rs7114 genotypes and miRNA miR-4421 expression. The mean miR-4421 expression level was higher in individuals with ERP29 AG or GG (p = 0.02) when compared with the AA genotype. (E) Luciferase activity in different groups: (1) pMIR-ERP29_AA (ERP29 rs7114 AA genotype) co-transfected with miR-4421 inhibitor; (2) pMIR-ERP29_AA co-transfected with miR-4421 mimics; (3) pMIR-ERP29_GG (ERP29 rs7114 GG genotype) co-transfected with miR-4421 inhibitor; and (4) pMIR-ERP29_GG co-transfected with miR-4421 mimics, in pharynx squamous cell carcinoma cell line, FaDu (ATCC). (*) FaDu cells co-transfected with pMIR-ERP29_GG and miR-4421 mimics presented lower luciferase activity when compared with those co-transfected with pMIR-ERP29_AA and miR-4421 mimics (p = 0.001). (**) FaDu cells co-transfected with pMIR-ERP29_GG and miR-4421 inhibitor featured an increase in luciferase activity when compared with those co-transfected with pMIR-ERP29_GG and miR-4421 mimics (p < 0.001). (F) Probability of event-free survival (EFS) of 102 base of tongue squamous cell carcinoma patients stratified by ERP29 rs7114 SNV genotypes. The Kaplan–Meier curve indicates lower EFS in patients with the GG variant genotype (0.0% vs 36.2%, p = 0.01) when compared with patients with AA or AG genotypes. All statistical data analyses were performed using SPSS version 21.0 (www.ibm.com/analytics/spss-statistics-software).

