
Figure 4.
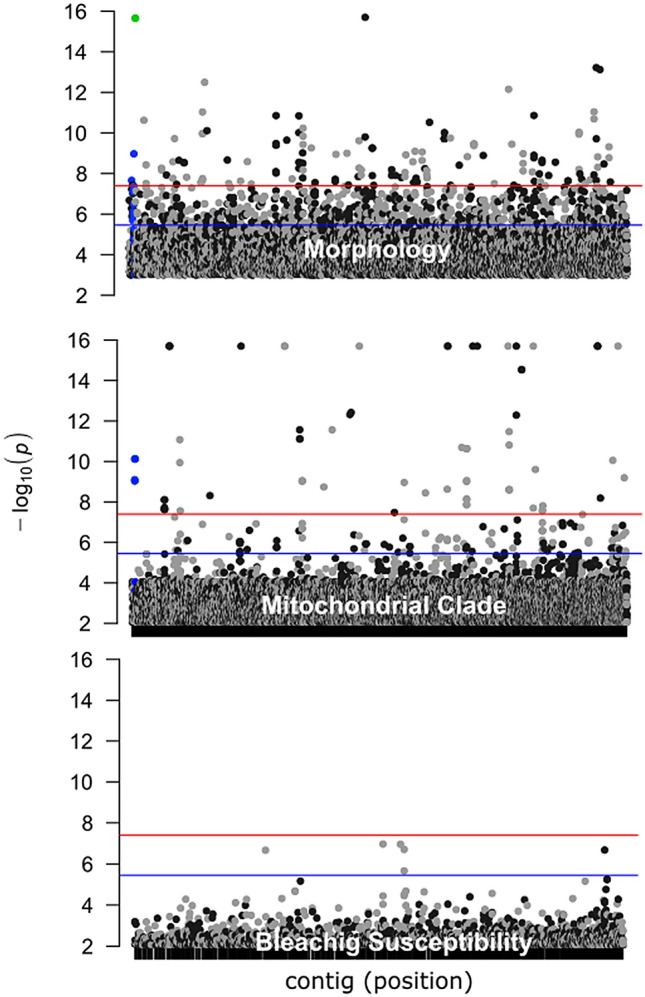
Candidate outlier loci that mapped to the P. lobata host transcriptome. Manhattan plots of morphology (branching vs. mounding), mitochondrial clade (B vs. C) of P. compressa, and bleaching susceptibility (bleached vs. unbleached) of P. compressa. The colored lines represent the Bonferroni (red) and FDR (blue) corrections for multiple comparisons. Values above the red line were considered ‘highly significant’ outlier loci and between the blue and red lines were considered ‘significant’ candidate outlier loci. Values above 1 × 10¹⁶ are shown as 1 × 10¹⁶ to standardize the y axis. The green dot represents fixed differences between the chloroplast 23S ribosomal gene from the algal symbiont, and blue dots represent mitochondrial loci.