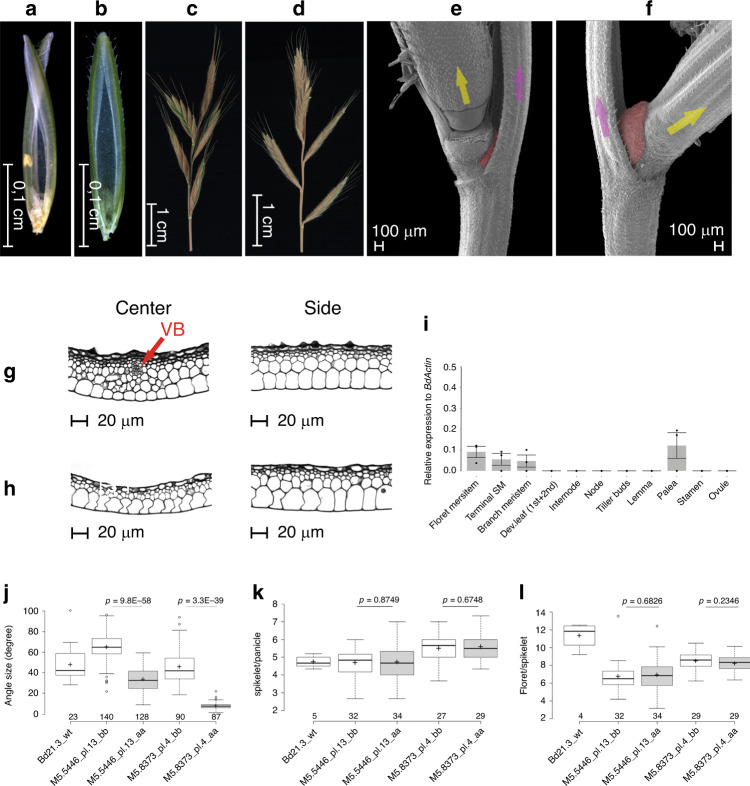
Fig. 6. Inflorescence morphology and the gene expression pattern in Brachypodium.
a Paleae of Brachypodium mutants show scissor-like structures that collapse easily due to external mechanical pressure; b normal/solid palea structure in Wt plants. c Brachypodium mutant inflorescence with compact shape due to acute branch (spikelet) angles; d Brachypodium Wt inflorescence with normal architecture of expanded branch angle as result of normal growth with pulvinus. e SEM view of an abnormal tiny pulvinus (in red) of a Brachypodium mutant versus an intact normal-sized pulvinus (in red) in Wt (f); arrows in yellow and pink represent the lateral branch and rachis, respectively, both in (e, f). g Histological view of transverse section of Brachypodium mutant palea as compared to Wt (h); Brachypodium mutant has an extra VB in the center part (red arrow) that is lacking in Wt. Center refers to the collapsed middle part, while Side refers to the flanking intact area (the blades of the scissor; see part a). i RT-qPCR of BdBAD1/WAB1 gene expression across meristematic stages and organs in Wt. Data collected from n = 3 biologically independent experiments, n = 15–25 plants per experiment, mean ± SE of three biological replicates. j Branch angle measurement in Brachypodium as proxy for pulvinus size. k Number of spikelets per individual Brachypodium inflorescence (panicle). l Number of florets per spikelet in Brachypodium. In j–l; data are from contrasting M6 homozygous TILLING lines of Brachypodium; aa and bb refer to homozygous mutant (aa) and Wt (bb) alleles from the same family (Supplementary Note 1). Per box plot, plus signs show the means while center bold-lines show the medians; box limits indicate the 25th and 75th percentiles; whiskers extend 1.5 times the interquartile range, outliers are represented by circles. Values above x-axis indicate number of angles measured in (j), and number of plants in (k, l). P values were determined by two-tailed Student’s t-test. Genotype IDs below x-axis refer to the parental line of the respective M6 family. Data presented in (j–l) are based on a single greenhouse experiment. Source data underlying (j–l) are provided as a Source data file.

