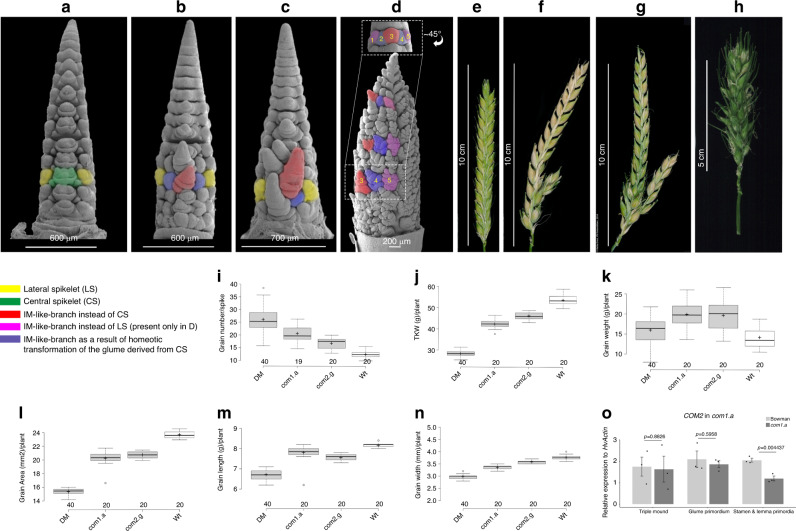
Fig. 8. Phenotypic analysis of double versus single mutants and COM2 transcript levels in com1.a.
a SEM-based view of an immature spike of Wt cv. Bowman, single mutant com1.a (b), single mutant com2.g (c) and those of a DM mutant (d). In d upper panel shows basal nodes of a DM spike at GP stage with elongated CSM (as compared to Wt in Fig. 1g) and unusually enlarged glume primordia (in purple). Numbers 1–5 denote five IM-like branch meristems of a DM spike that eventually represents a putative ten-rowed spike. The lower panel is rotated by ~45° to the left while imaging. Please note IM-like branches 1 and 2 are invisible in the lower panel. Immature spikes (except d upper panel) are at similar developmental stages of early/advanced stamen primordium. Immature spikes in (b, c) represent typical SBS while d corresponds to the immature CBS spike class. e–h Showing mature spikes with Wt cv. Bowman depicted in (e), single mutant com2.g shown in (f) (reproduced from Poursarebani et al.13 with the kind permission from Genetics Society of America), single mutant com1.a shown in (g), and the mature spike in a DM plant displayed in (h). f, g Represent a frequent phenotype of the SBS class at maturity while d represents a mature CBS phenotype. i–n Grain characters of the DM plants, and the corresponding single mutant com1.a and com2.g in comparison to the Wt cv. Bowman. Data are based on a single greenhouse experiment and on averages of 20 plants (390–540 spikes) per phenotypic class. Per box plot, plus signs show the means while center bold-lines show the medians; box limits indicate the 25th and 75th percentiles; whiskers extend 1.5 times the interquartile range, outliers are represented by circles. o Depicts COM2 transcript levels in the com1.a mutant compared to Wt cv. Bowman. Data are generated from three biological replicates from 15–25 plants per experiment; mean ± SE of three biological replicates. Genotype differences were tested at a significance level of P > 0.05 using the two-tailed paired Student’s t-test. Source data underlying (i–n) are provided as a Source data file.

