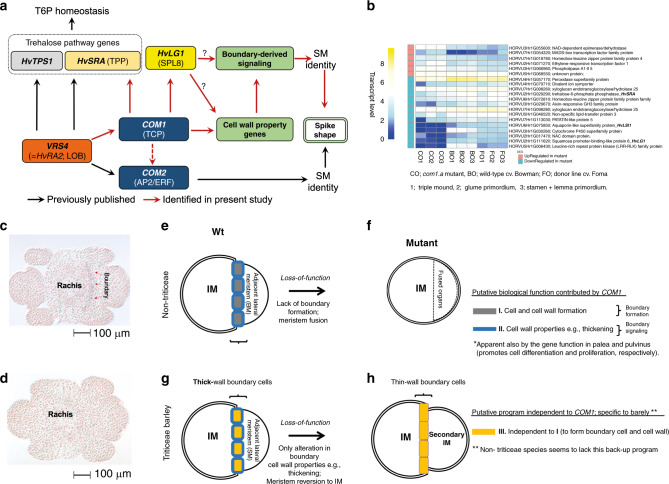
Fig. 9. COM1 transcript-based regulatory scheme, HvLG1 mRNA signals and model of COM1 functional differences from non-Triticeae.
a Model of COM1 transcriptional regulation in barley deduced from either RNAseq or RT-qPCR results. Black arrows are interactions reported previously13,28 while red arrows are detected in the current study (see Supplementary Fig. 10, the legend). b RNAseq-based heat map of selected differentially expressed (DE) genes (see Supplementary Fig. 9 for the remaining DE genes). The transcript level of each gene in mutant com1.a (CO) is compared with two Wts, cv. Bowman (BO; parent of the mapping population) and cv. Foma (FO; the donor line), at three different meristematic stages. Transcript level was calculated using Eq. (1) (see “Methods”). c mRNA in situ hybridization of barley LG1 in the immature spike using the antisense (d) and sense probes (see “Methods”). Tissues represent cross-section through spikelet meristems in barley cv. Bonus at GP stages. e–h Proposed IM-to-BM boundary formation due to Wt gene function in non-Triticeae grasses (e). Lack of boundary formation due to the loss-of-function allele (f). Of note, involvement in the alteration of the boundary cell walls within non-Triticeae species cannot be excluded. g Proposed IM-to-SM boundary formation in Wt barley; restriction of COM1 function to altering cell wall properties (the blue program), due to evolutionary functional differences. h Reversion to the previous identity state (IM) observed in barley com1.a due to lack of putative wall-amplified micromechanical signals needed to confer SM identity. Source data underlying (a–d) are provided as a Source data file.

