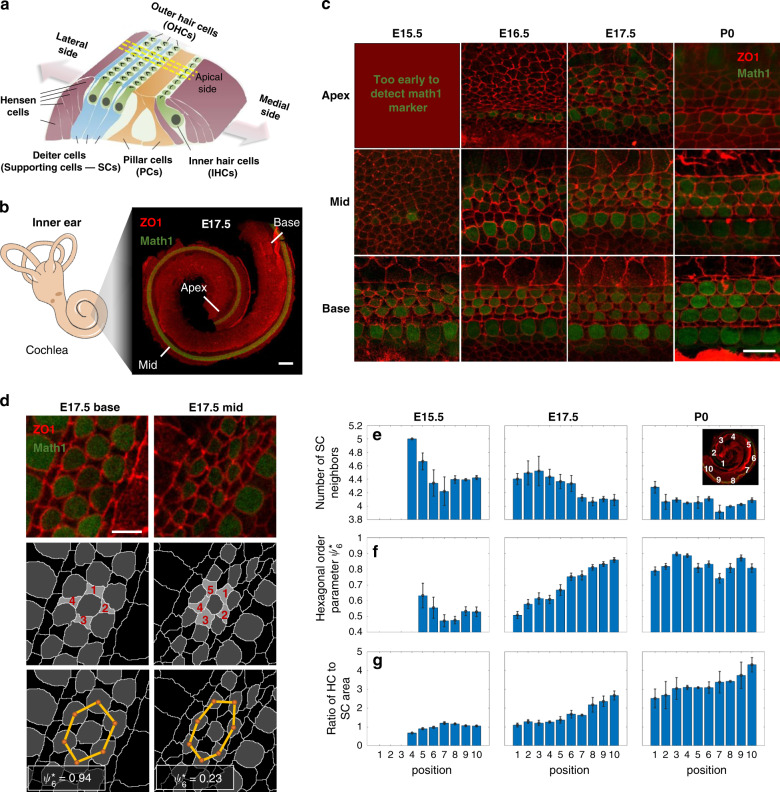
Fig. 1. Hair cells gradually reorganize into a checkerboard-like pattern.
a Schematic of the organ of Corti. b Left: schematic of the mammalian inner ear. Right: Confocal image of the cochlea of a E17.5 mouse embryo marking the base, mid and apex regions. Cochleae are taken from transgenic mice expressing Math1-GFP (green) and are immunostained with α-ZO1 (red). Scale bar: 100 μm. c Representative images at different developmental times and different positions along the base-to-apex axis. Rows and columns correspond to different positions along the cochlear axis and different development times, respectively, as indicated. Scale bar: 10 μm. d Schematic of the definition of two order parameters: (i) The number of SC neighbors of each HC in OHC2 (middle row) and (ii) hexagonal order parameter (bottom row). Yellow lines connecting HC centroids (orange dots) demonstrate higher hexagonal order at the base relative to the mid. values for each centroid cluster are as indicated. Scale bar: 5 μm. e–g Morphological and order parameters in different regions of the cochlea from apex to base (defined in inset) and at different developmental times (columns). Rows correspond to number of SCs neighbors (e), hexagonal order parameter (f), and ratio of HC to SC surface area (g). Local measures of order parameters associated with each HC are pooled by developmental age over n = 3,4,3 cochleae at E15.5, E17.5, P0, respectively, and then binned by cochlear position. Bars represent average on all local orders parameters within each bin. Error bars represent S.E.M. Schematic in a is modified with permission from Dror and Avraham34.

