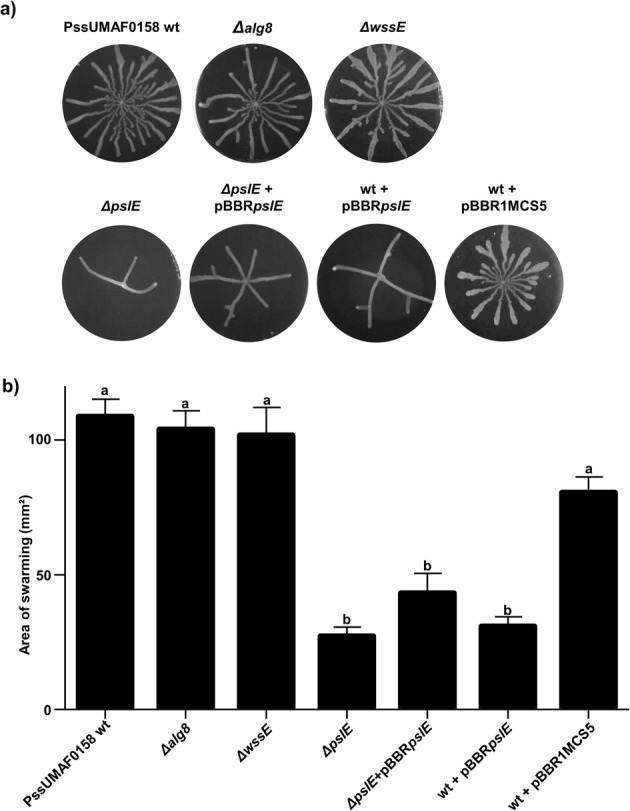
Fig. 6. Swarming motility.

Effect of polysaccharide production on swarming motility. a Representative images of swarming plates incubated at 25 °C at 48 h postinoculation. b Swarm motility area after 48 h of growth at 25 °C. The PssUMAF0158 wild-type (PssUMAF0158 wt), PssUMAF0158 alginate mutant (Δalg8), PssUMAF0158 cellulose mutant (ΔwssE), PssUMAF0158 Psl-like polysaccharide mutant (ΔpslE), Psl-like complemented strain (ΔpslE + pBBRpslE), pslE overexpression strain (wt + pBBRpslE) and vector control (wt + pBBR1MCS5) were tested. Three plates per experiment, and three independent experiments were performed. Statistical analysis was performed using ANOVA with the Bonferroni correction test. Three replicates, and three independent experiments were performed. Different letters represent statistically significant differences, p < 0.05. Error bars show the standard error of the mean (s.e.m.).
