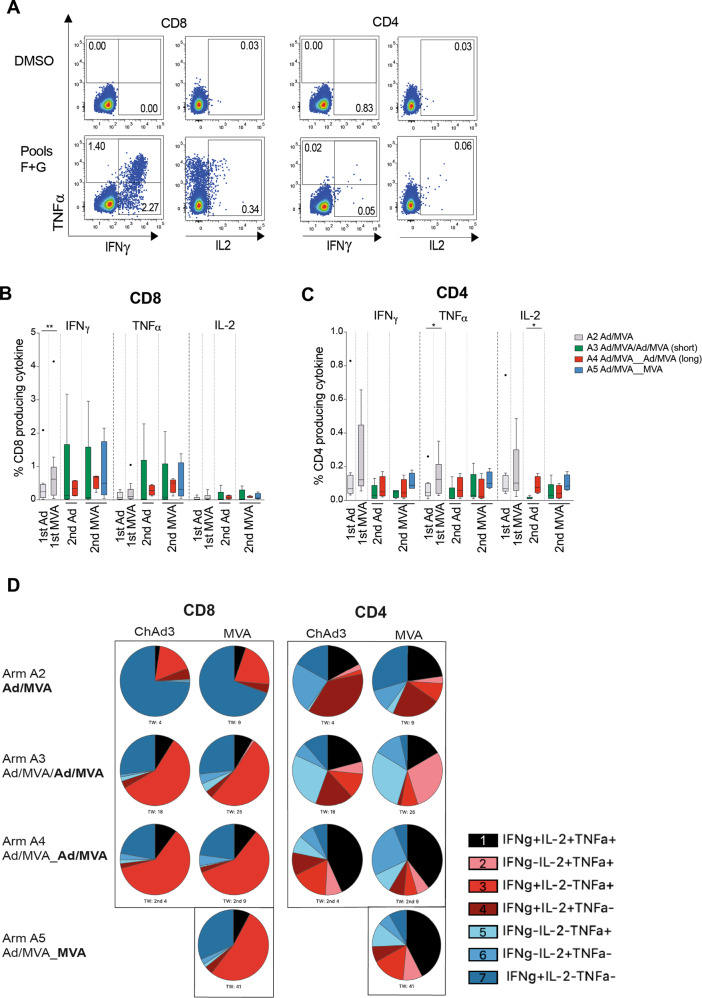
Fig. 3. Cytokine-producing HCV-specific T cells are induced by reboosting after a long interval.
a–c Comparison of ex vivo cytokine production by T cells at the time of peak magnitude of response (peak NS response by IFNγ ELISpot) to each vaccination (1–4 weeks post-ChAd3-NSmut and MVA-NSmut). a Example plots showing TNFα/IFNγ and IL-2/TNFα after ICS for CD4+ and CD8+ T cells stimulated with pools F+G or DMSO control (volunteer 343 arm A5 TW41, 2nd MVA; see Supplementary Fig. 4 for full gating strategy). The percentage of total CD8+ (b) or CD4+ (c) T cells producing IFNγ, TNFα, or IL-2 after overnight stimulation with peptides covering the non-structural region of HCV within the vaccines (Pools F+G, H+I, L+M summed after subtracting values for paired DMSO wells from each stimulation) are shown. d The proportion of the transgene-specific CD4+ or CD8+ T cells producing different combinations of IFNγ, TNFα, and IL-2 are presented as pie charts (base mean) at the peak of the T cell response post vaccination (samples with a transgene-specific response <0.025% of CD4+ or CD8+ T cells were excluded from polyfunctionality analysis; n = 4–9 per arm). b, c Box–whisker Tukey, outliers shown as dots (n = 9 A2, n = 5 arm A3, n = 4 arms A4, A5). Wilcoxon paired t test 1st Ad vs. 1st MVA, Mann–Whitney unpaired t test for 2nd Ad A3 vs. A4, Kruskal–Wallis one-way ANOVA with Dunn’s correction for 2nd MVA A3, A4, A5 per cytokine. Ad, adenovirus; MVA, modified vaccina Ankara. *P < 0.05; **P < 0.005.

