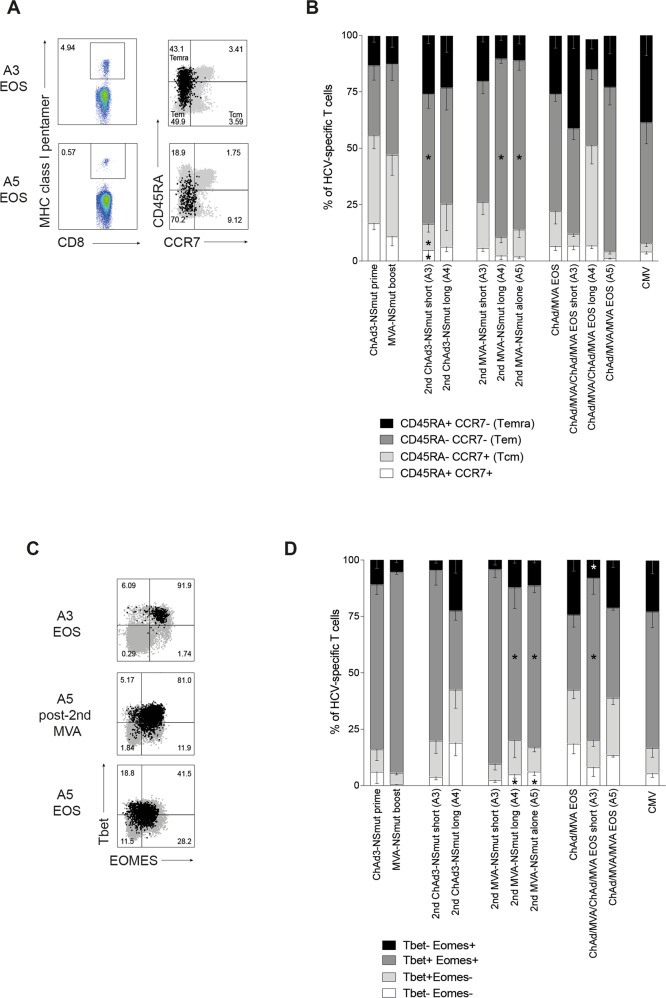
Fig. 6. Reboosting alters the proportions of T cell memory subsets.
(a–d) PBMC from HLA-A*01+ or A*02+ individuals were co-stained ex vivo with individual MHC class I pentamers and antibodies against surface markers CD45RA, CCR7 (a, b), or intranuclear transcription factors Tbet and Eomes (c, d). a Example FACS plots (pentamer gating and overlay of total CD8+ in grey and pentamer+ in black; see Supplementary Fig. 4 for full gating strategy). b Stacked bars showing the proportion of pentamer+ T cells with a given phenotype at the peak of the T cell response (1–4 weeks post vaccination, according to IFNγ ELISpot) after each vaccination and at the end of the study (EOS; n = 4–13 per pie). Where CMV responses were detected by IFNγ ELISpot in HLA-A*02+ individuals an immunodominant CMV pentamer was used in parallel (n = 10). c Example FACS plots (overlay of total CD8+ in grey and pentamer+ in black). d Stacked bars showing the proportion of pentamer+ T cells co-expressing Tbet and Eomes at the peak of the response (1–4 weeks post vaccination, according to IFNγ ELISpot) after each vaccination and at the end of the study (n = 4–13 per pie). The proportion of CMV-specific T cells showing each subset phenotype is also shown (n = 6). b, d Mean, bars at standard error of mean. Kruskal–Wallis unpaired non-parametric Anova comparing ChAd3-NSmut prime vs. 2nd ChAd-NSmut short (A3) or long (A4), MVA-NSmut boost vs. 2nd MVA-NSmut short (A3) or long (A4) or alone (A5), ChAd3-NSmut/MVA-NSmut EOS vs. ChAd/MVA/CMVA EOS short (A3) or ChAd/MVA/MVA (A5). *P < 0.05.

