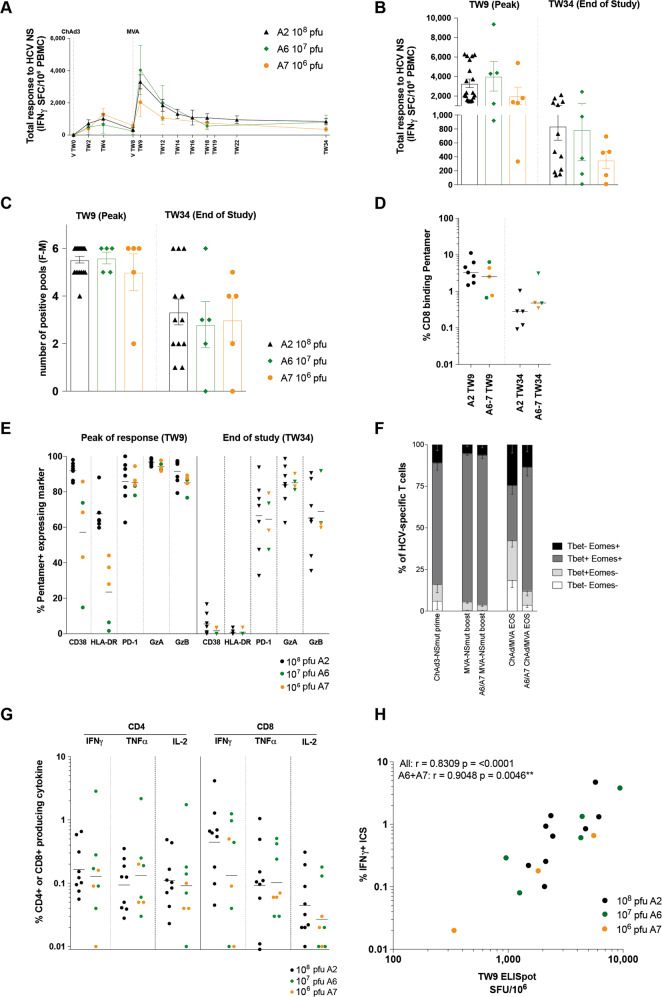
Fig. 7. The magnitude, breadth, functionality, and phenotype of vaccine-induced HCV-specific T cells are unchanged when using a medium MVA-NSmut dose when compared to high dose.
a–h Healthy volunteers receiving ChAd3-NSmut prime vaccination were boosted with high (108 pfu; black dots, arm A6), medium (107 pfu; green dots, arm A7), or low dose (106 pfu; orange dots) MVA-NSmut vaccination 8 weeks later (Supplementary Table 1). a, b: the summed ex vivo IFNγ ELISpot response to HCV NS encoded in the vaccine. a Kinetics of the HCV-specific T cell response across the vaccine trial (group mean). b–e Comparison of peak (1-week post-MVA-NSmut, TW9) and memory (end of study [EOS], TW34) (b) HCV-specific T cell response, (c) breadth of the HCV-specific T cell response (number of positive pools, see methods), (d) percentage of CD8+ T cells binding MHC class I pentamers ex vivo (NS31435–1443, NS31406–1415), and (e) percentage of HCV-specific pentamer+ T cells expressing CD38, HLA-DR, PD-1, granzyme A (GzA) or granzyme B (GzB). f The percentage of pentamer+ T cells co-expressing Tbet and Eomes at the peak of the T cell response after ChAd3-NSmut prime (TW2-4), after MVA-NSmut (TW9) and at EOS (arms A6 and A7 combined; TW34). g The percentage of CD4+ or CD8+ T cells producing IFNγ, TNFα or IL2 at the peak of the T cell response (TW9). h Correlation between the magnitude of HCV-specific T cell response induced by vaccination as measured by response to peptide pool G by ELISpot and percentage pentamer+ (immunodominant epitope in pool G, HLA-A*02-restricted NS31406–1415). Spearman r calculated for all data combined or for A6 and A7 data combined. a–c mean ± standard error of mean. d, e, g Bars at median. b, c, e, g Kruskal–Wallis one-way Anova with Dunn’s correction for multiple comparisons, all non-significant. d Mann–Whitney t test non-significant.

