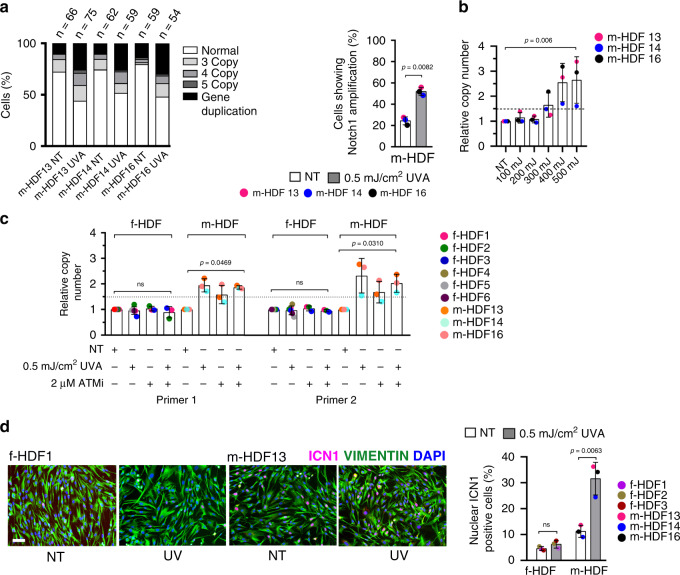
Fig. 4. Expansion of cultured dermal fibroblast populations with NOTCH1 gene amplification and protein overexpression upon repeated UVA exposure.
a Left panel: quantification of NOTCH1 gene copy number by FISH with a NOTCH1-specific probe in parallel with a probe for chr9 q21.3 localization in m-HDF strains irradiated with UVA 500 mJ/cm2 every other day for three times versus mock-treated control (NT). FISH analysis was performed 72 h after the last exposure. The number of analyzed nuclei (n) was obtained from two independent experiments. Right panel: quantification of the percentage of cells showing NOTCH1 amplification in m-HDFs plus/minus UVA treatment. Values for each strain are indicated as dots with mean ± s.d. two-tailed unpaired t-test, **p < 0.001. n(m-HDF strain) = 3. b Quantification of NOTCH1 gene copy number in m-HDF strains plus/minus repeated UVA treatment (100, 200, 300, 400, and 500 mJ/cm2) versus mock treated control as in a. Primers for NOTCH1 gene were used together with primers specific for the housekeeping gene GAPDH for internal normalization. Values for each strain are indicated as dots with mean ± s.d. One-way ANOVA with Friedman test, **p < 0.01. n(m-HDF strain) = 3. An additional independent experiment is shown in Supplementary Fig. 3b. c Quantification of NOTCH1 gene copy number in f-HDF versus m-HDF strains plus/minus chronic UVA exposure as in a. Parallel cultures were also treated with ATM inhibitor (ATMi) KU-60019 (2 µM) as indicated. Two primers for NOTCH1 gene were used. Relative DNA copies were calculated after GAPDH internal normalization relative to mock-treated control. Values for each strain are indicated as dots with mean ± s.d. One-way ANOVA, *p < 0.05. n(f-HDF strain) = 6, n(m-HDF) = 3. d Representative images and quantification of immunofluorescence analysis of ICN1 expression in f-HDF and m-HDF strains upon chronic UVA treatment as in a versus mock-treated control (NT). Scale bar, 10 μm. >201 cells were scored per sample. Values for each strain are indicated as dots with mean ± s.d. two-tailed unpaired t-test, *p < 0.05. n(f-HDF strain) = 3, n(m-HDF strain) = 3.

