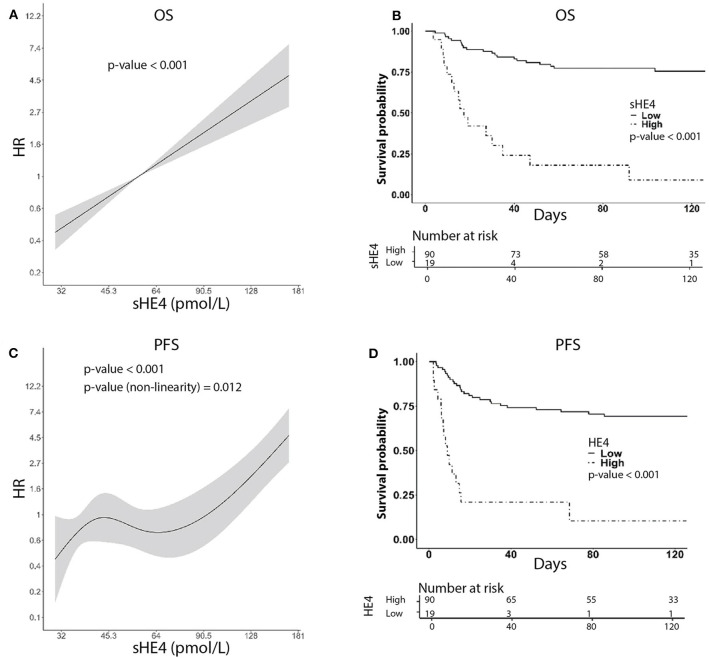
Figure 2.
Univariable survival curves using HE4 as predictor. (A,C) Show HR as a function of HE4 levels for OS and PFS, respectively. (B,D) Show Kaplan–Meier curves, respectively, for OS and PFS, derived from sHE4 levels categorization based on cut-point estimation via generally maximally selected statistic. For illustration purposes, we label the estimates as low and high levels of HE4.

