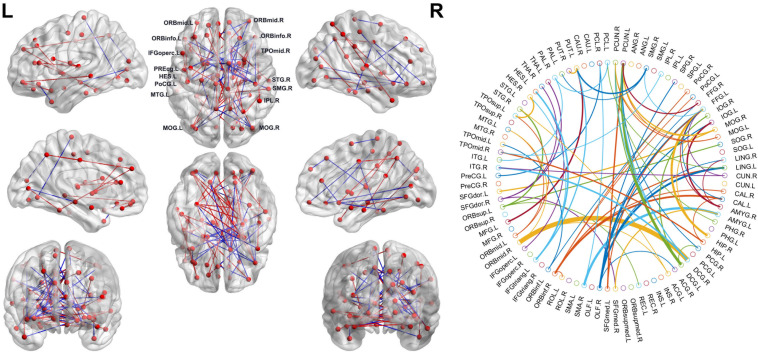
FIGURE 2.
Left: The consensus connections selected by leave-one-out cross-validation (LOOCV). The connections were mapped on the ICBM 152 template with the BrainNetViewer package (http://nitrc.org/projects/bnv/). Blue and red represent the decrease and increase of functional connection weight of subjective cognitive decline (SCD) groups, respectively. Right: The consensus connections of functional brain network selected by LOOCV in SCD and normal control (NC) groups based on AAL90. The thickness of an arc in the circle indicates the discriminative power of an edge, which is inversely proportional to the estimated P-values. The colors were randomly generated to differentiate regions of interests (ROIs). The figure was conducted with a MATLAB function, circularGraph, shared by Paul Kassebaum. (http://www.mathworks.com/matlabcentral/fileexchange/48576-circulargraph).

