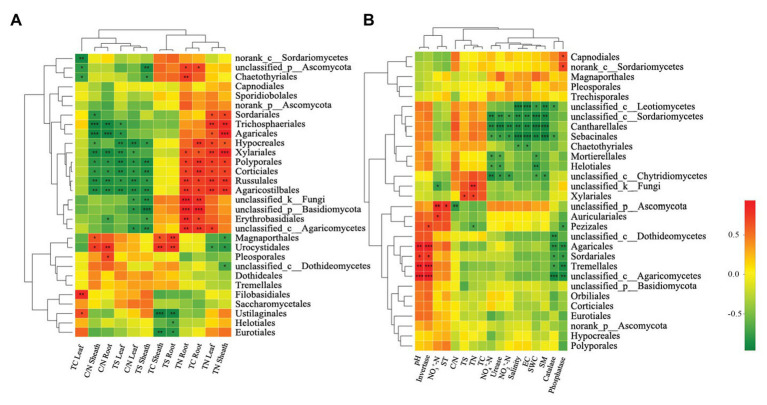
Figure 5.
Correlation heatmap of the top 30 orders and soil properties and vegetation. Phyllosphere and rhizosphere fungal communities are shown in (A,B), respectively. X and Y axis are environmental factors and orders. R in different colors to show, the right side of the legend is the color range of different R values. *p < 0.05; **p < 0.01; ***p < 0.001.

