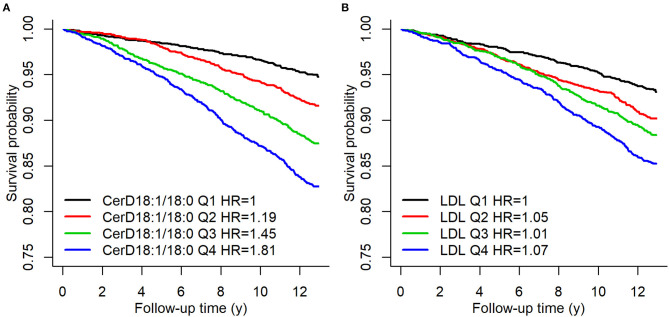
Figure 1.
Kaplan–Meier estimates of incident MACE Cer(d18:1/18:0) and LDL-C quartiles. A hazard ratio in the legend indicates the quartile specific hazard relative to the 1st quartile (models stratified for sex). Figure from Havulinna et al. (21). Figure reproduced under the terms of the Creative Commons Attribution License.

