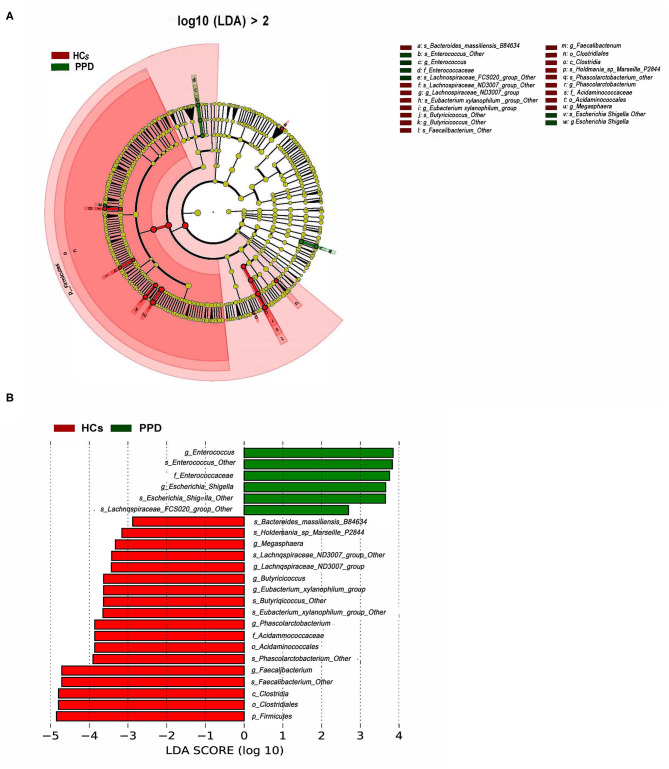
Figure 5.
Bacterial taxa differences between healthy control (HC) and postpartum depressive disorder (PPD) patient samples. Cladogram showing the most differentially abundant taxa identified by linear discriminant analysis effect size (LEfSe). Red indicates clades enriched in the HC group, whereas blue indicates clades enriched in the PPD group (A). Comparisons of gut microbiota between the NC and PPD groups (B). Only genera meeting a linear discriminant analysis score threshold >2 are shown.

