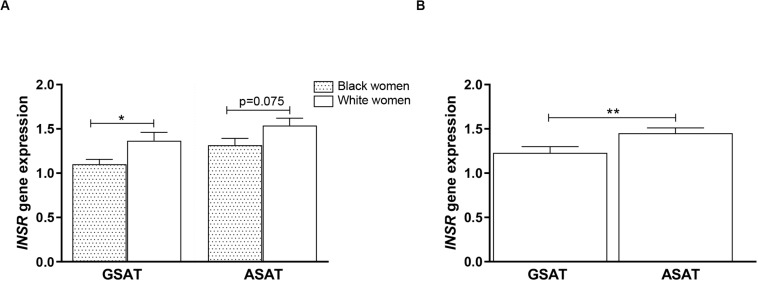
FIGURE 7.
INSR gene expression in gluteal (GSAT) and abdominal (ASAT) subcutaneous adipose tissue of normal-weight and obese black and white South African women. (A) INSR expression according to ethnicity, irrespective of BMI status (n = 18–28 per group). (B) INSR expression in paired GSAT and ASAT samples, irrespective of ethnicity and BMI (n = 35 per group). INSR expression was normalized to the endogenous control RPLP0 and data are presented as the mean and SEM. *p < 0.05, **p < 0.01.

