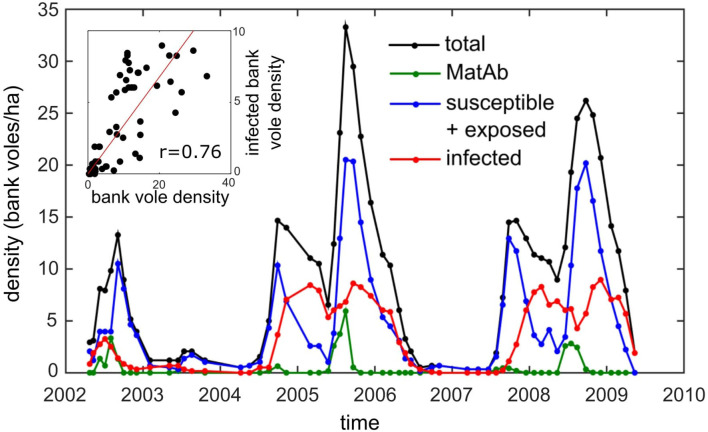
Figure 1.
The density of bank voles (black) and the density of the different infection status categories: susceptible (and exposed) for PUUV infection (blue), infectious (red), and carrying maternal antibodies (green) on the core 5.8 ha study grid (data from Voutilainen et al., 2016). Inset: the correlation of the overall and infected bank vole densities (r = 0.76, p < 0.0001).

