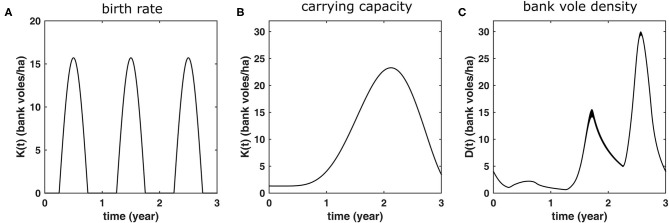
Figure 2.
Bank vole demography as it is implemented as a 3-years cycle in the model simulations. These same conditions shown in are repeated every 3 years. (A) The rate at which adult females produce five-offspring litters, (B) the carrying capacity K(t) which is used in order to produce (C) population dynamics with bank vole density D(t) similar to those measured in the field (see Figure 1). The latter curve shows the average of 100 3-years cycles, with the width of the curve equals twice the standard deviation. Hence, the more variation (due to the stochastic nature of the model), the thicker the curve.

