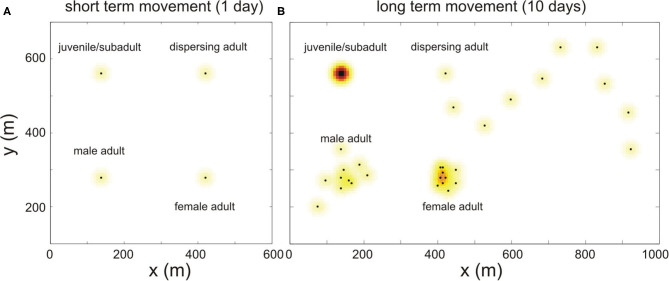
Figure 4.
Schematic illustration of how bank vole movement is implemented in the model. (A) The short term movement (during 1 day) is simulated for every maturation status with the same Gaussian pdf, shown in color; the black dots represent the center of their home ranges. (B) The simulated movement of these same voles, during a longer period (10 days). This long term movement is modeled differently depending on the bank vole's maturation status, see text.

