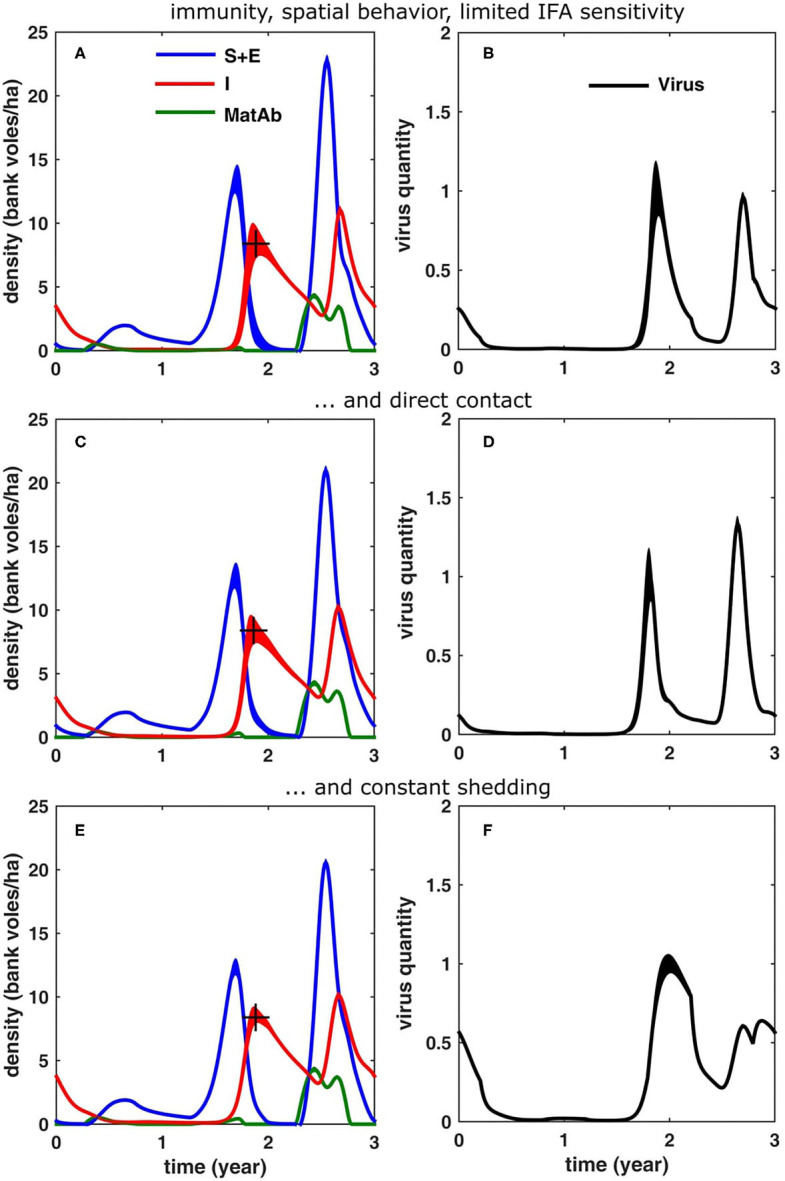
Figure 6.

Simulation results (averaged over 100 cycles; the width equals twice the standard deviation) for different scenarios, see text: (A,B) same as in Figures 5G,H, but now if it is assumed that the immuno-fluorescent assay (IFA) has a limited sensitivity to maternal antibodies (MatAb); (C,D) if only direct transmission is assumed and (E,F) if the virus shedding does not decrease over time.
