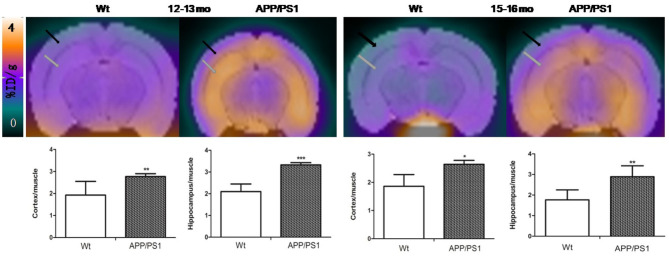
Figure 5.
The PET images were aligned with the mouse brain MRI template atlas. We selected the hippocampus and cortex as the VOIs and calculated their percentages of injected dose per gram (%ID/g). PET/MRI template atlas fusion images and graphs representing [18F]DPA714 signals in APP/PS1 vs. Wt mice 12–13 and 15–16 months of age. Black and gray arrows point to cortex and hippocampus, respectively (*p < 0.05, **p < 0.01, ***p < 0.001).

