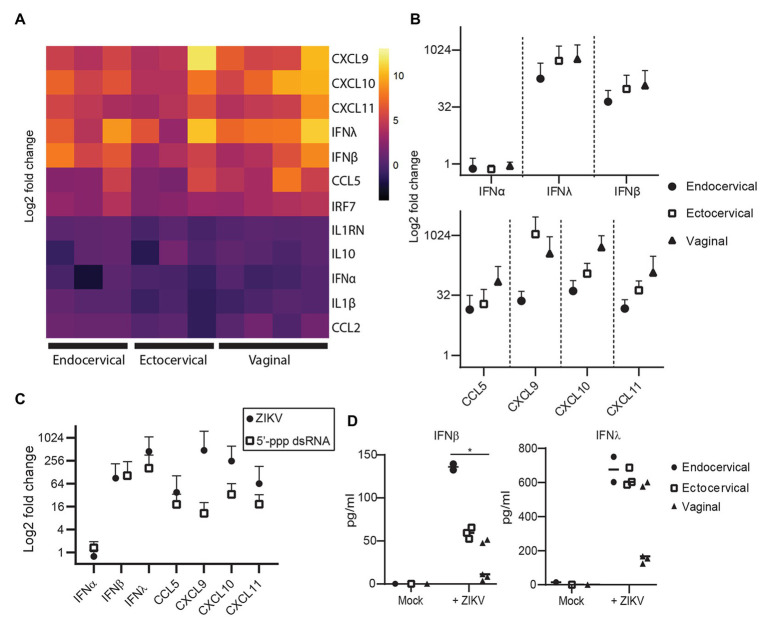
Figure 2.
Immune response of genital epithelial cells to ZIVK infection. (A) RNA from cells infected with ZIKV at an MOI of 1 for 72 h was analyzed for the indicated genes by quantitative PCR (qPCR). Heatmap of log2 fold regulation of each analyzed gene compared to mock infected control cells, averaged from two independent wells. Cell type is indicated on the x-axis; each column is a separate cell line. (B) Numerical representation of the data shown in panel (A) averaged for each tissue type. Error bars indicate one standard deviation. (C) Three epithelial cell lines (one for each tissue type) were treated with 10 μg/ml of the RIG-I agonist 5'ppp-dsRNA complexed with LyoVec (InvivoGen), or infected with ZIKV at an MOI of 1 for 24 h. RNA was isolated and gene expression of the indicated cytokines was measured by qPCR. Plotted is the mean response of all epithelial cell lines to ZIKV infection at 72 hpi compared to the mean response to 5'ppp-dsRNA. (D) Supernatants from cell cultures in (A) were analyzed for IFNα, IFNβ, and IFNλ using a Meso Scale Discovery assay. IFNα was below the limit of detection in all samples and is not shown. Concentration of IFNβ and IFNλ in ZIKV-infected and mock-control cell culture supernatants are shown, each point is the average of two independent wells, and at least two cell lines from each tissue type were tested. Horizontal bars indicate mean concentrations. Differences between cell types were tested by one-way ANOVA with Tukey’s test. * p < 0.05.

