Figure 5.
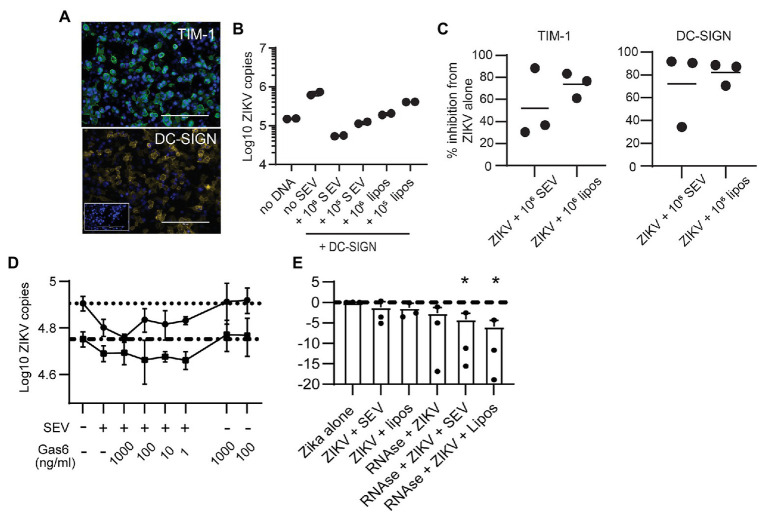
Seminal extracellular vesicles and liposomes inhibit ZIKV by causing loss of virion membrane integrity. (A) HEK293 cells were transfected to express the DC-SIGN or TIM-1 receptors. Twenty-four hours post transfection, cells were stained with antibodies against TIM-1 (top panel, green) or DC-SIGN (bottom panel, yellow) to visualize expression of receptors. DAPI staining visualizes the cell nucleus (blue). Mock-transfected cells incubated with anti-DC-SIGN are shown in the inset for the DC-SIGN panel. Scale bar is 200 μm for all images (imaged at 20x magnification). (B) ZIKV was incubated alone or with 106 SEV or liposomes per PFU for 1 h prior to infecting DC-SIGN transfected cells at an MOI of 1 for 1.5 h. Inoculum was removed and cells were cultured for 24 h, then cultures were lysed. Log copies of ZIKV RNA quantified by ddPCR and normalized to the housekeeper gene RPP30 are plotted. Each symbol is from one well. Plot is a representative result from two separate experiments. (C) HEK-293 cells transfected to express DC-SIGN or TIM-1 were infected as in B, and the percent inhibition from the ZIKV alone condition is plotted. Each symbol is the average of two duplicate wells from two separate experiments and the line indicates the mean (D) ZIKV was incubated alone or with 105 SEV per PFU for 1 h, prior to infecting cells. During incubation with viral inoculum, recombinant Gas6 protein was added to the culture at the indicated concentrations. After 1.5 h, viral inoculum was removed and cells were lysed to quantify ZIKV genomes with ddPCR. Each line represents the average of two technical replicates from two different epithelial cell lines, done in separate experiments. Dotted lines show the copy numbers obtained in the ZIKV alone condition for each cell line. (E) ZIKV virions were incubated alone or with 106 SEV or liposomes for 1 h at 37°. One microliter of an RNAse A/T1 cocktail was added for 20 min at 37°, and then samples were lysed for total RNA extraction. ZIKV genomes were quantified with qPCR. Log10 copies of ZIKV virus genome normalized to the virus alone condition are plotted; the line indicates ZIKV alone. Results from three independent experiments are shown as dots; bars are mean and lines are standard deviation. * p < 0.007 by one-way ANOVA with Tukey’s multiple comparisons test.

