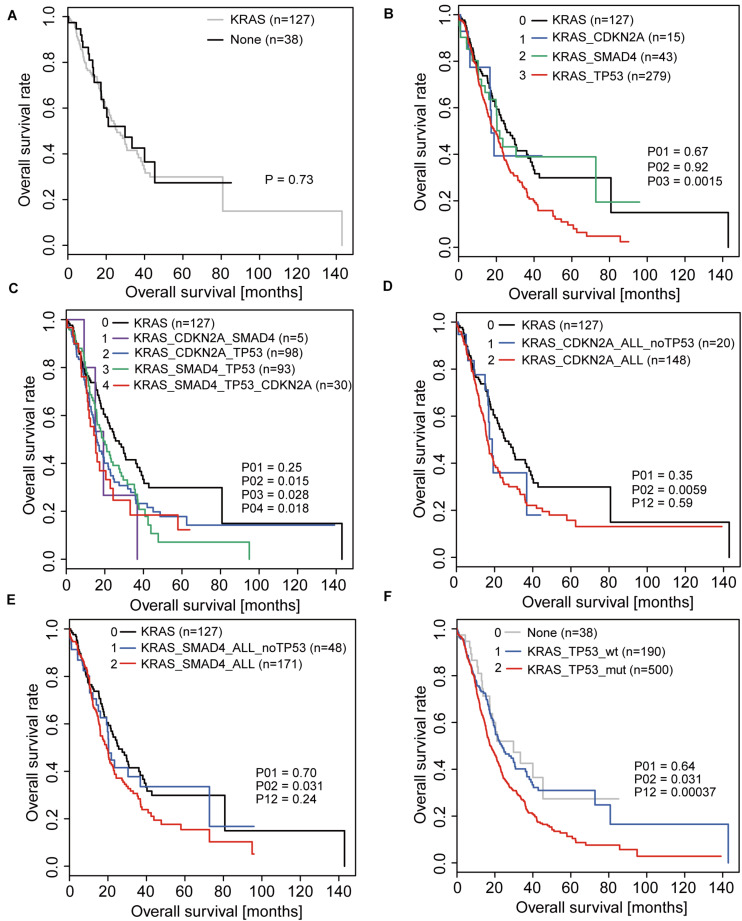
FIGURE 1.
Overall survival (OS) analyses in PDAC patients correlated with driver gene mutations. (A) OS of patients with KRAS mutations only and without any driver gene mutations. (B) OS of patients with mutations in only one driver gene based on the activation of KRAS. (C) OS of patients with coexistence of mutations in driver genes based on the activation of KRAS. (D,E) OS of patients with CDKN2A mutations (D) or SMAD4 mutations (E) when considering and not considering TP53 mutations. (F) OS of patients with and without TP53 mutations.

