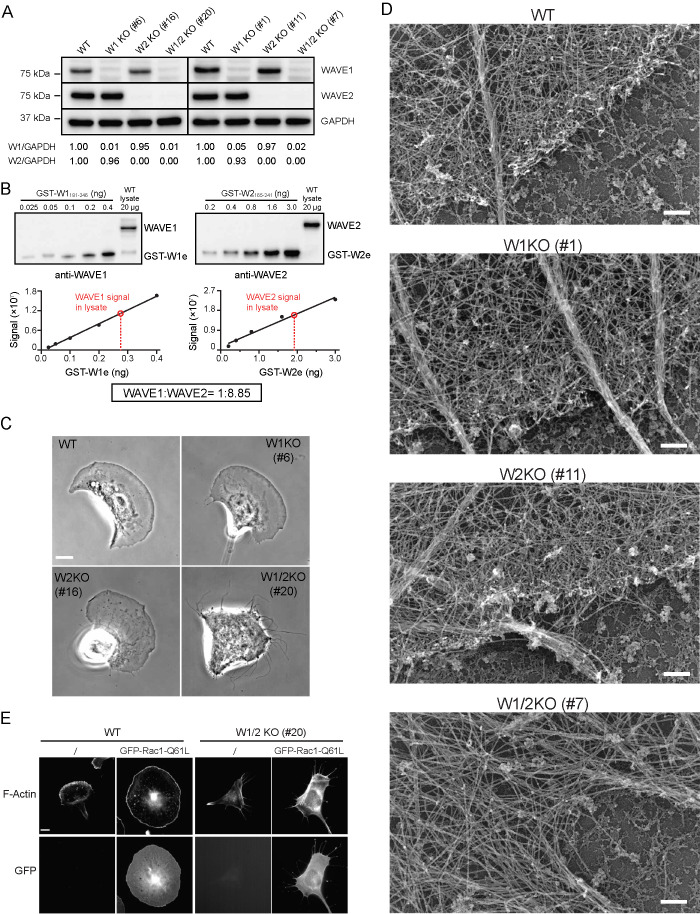
FIGURE 1:
WAVE1 and WAVE2 have redundant roles in lamellipodia formation. (A) Representative Western blots showing levels of WAVE1 and WAVE2 proteins in two independent clones of each B16-F1 cell line. Below each lane is the WAVE to GAPDH intensity ratio normalized against WT cells (set to 1.00). (B) Top panels, representative blots showing signal of endogenous WAVE1 or WAVE2 in 20 µg of cell lysate compared with known amounts of purified GST-WAVE1(aa 181–246) (GST-W1e) or GST-WAVE2(aa 165–241) (GST-W2e). Bands were quantified by densitometry and compared with the standard curves (see graphs). Black filled circles, intensity of GST-W1e or GST-W2e. Black lines, linear fits for GST-W1e or GST-W2e. Red open circles, interpolated values of endogenous WAVE1 and WAVE2 in cell lysates. The concentration of WAVE1 in cell extracts was determined in three independent experiments (22.0, 30.8, and 39.4 nM), and WAVE2 in two independent experiments (285.8 and 263.4 nM), and the means were used to estimate their molar ratio in cells (boxed). (C) Representative phase-contrast images of B16-F1 WT and KO cell lines highlighting the morphological defects in W1/2KO cells. Scale bar, 10 µm. (D) Representative platinum replica electron micrographs of actin organization at the leading edge in the same cell lines. Scale bars, 200 nm. (E) Representative images of WT and W1/2 KO cells with or without ectopic expression of GFP-Rac1-Q61L, showing F-actin stained with Alexa568-phalloidin and GFP-Rac1-Q61L. Scale bar, 10 µm.

