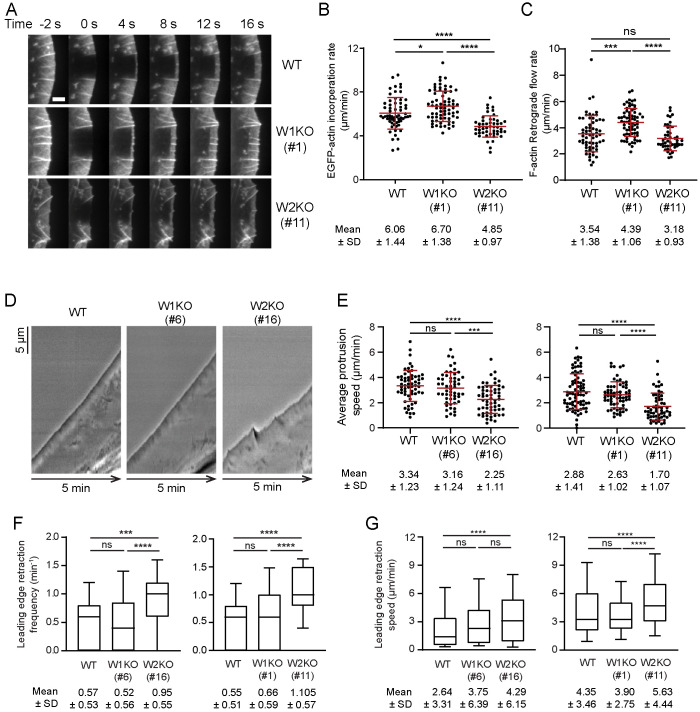
FIGURE 3:
WAVE1 and WAVE2 oppositely affect actin network growth rate. (A) Representative time-lapse images of lamellipodia in WT, W1KO (#1), and W2KO (#11) cells expressing EGFP-actin, showing fluorescence recovery after photobleaching (FRAP). Scale bar, 3 µm. (B) Rates of actin assembly (EGFP-actin incorporation, mean ± SD) at the leading edge determined from FRAP analysis as in A. Data pooled from two independent experiments (left to right: n = 62, 69, 49 cells). (C) Rates of actin retrograde flow (mean ± SD) for the same cells as in B. (D) Representative kymographs of lamellipodial dynamics. (E) Lamellipodia protrusion speeds (mean ± SD). Data pooled from three independent experiments (left to right: n = 60, 54, 59, 78, 65, 58 cells). (F) Box and whisker plot (10–90 percentile) showing frequency of leading edge retraction during the 5-min window for the same cells as in E. Mean ± SD shown below the plot. (G) Box and whisker plot (10th–90th percentile) showing leading edge retraction speed for the same cells as in E. Data pooled from three independent experiments (left to right: n = 168, 141, 280, 213, 214, 314 retraction events). Mean ± SD shown below the plot. One-way ANOVA and Tukey’s multiple comparison tests were performed in B, C, and E. Kruskal-Wallis tests were performed in F and G. *, p < 0.05; **, p < 0.01;***, p < 0.01, **** p < 0.0001; ns (p > 0.05), not significant.

