FIGURE 3:
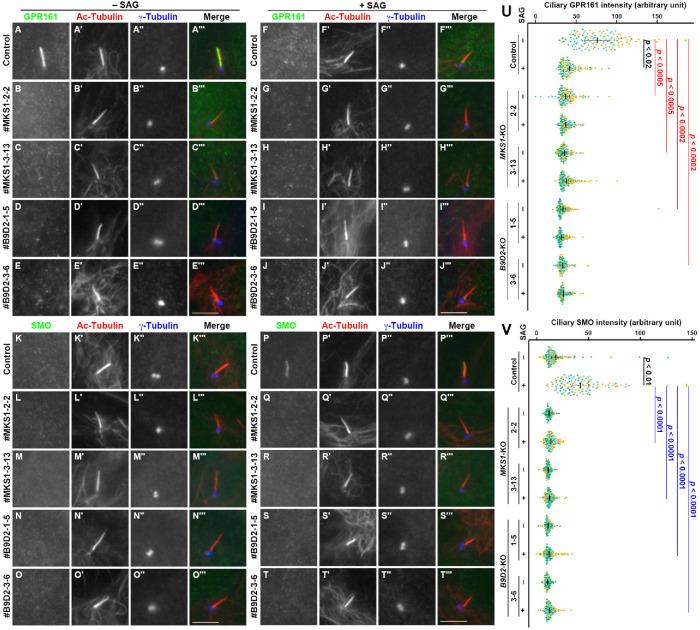
Absence of ciliary GPCRs in MKS1-KO and B9D2-KO cells. (A–T) Control RPE1 cells (A, F, K, P), the #MKS1-2-2 cell line (B, G, L, Q), the #MKS1-3-13 cell line (C, H, M, R), the #B9D2-1-5 cell line (D, I, N, S), and the #B9D2-3-6 cell line (E, J, O, T) were serum starved for 24 h and incubated for a further 24 h without (–SAG; A–E, K–O) or with (+SAG; F–J, P–T) 200 nM SAG. The cells were triple immunostained with an antibody against either GPR161 (A–J) or SMO (K–T) and against Ac-tubulin (A′–T′) and γ-tubulin (A′′–T′′). Scale bars, 5 µm. (U, V) Relative ciliary staining intensities of GPR161 and SMO in control, MKS1-KO, and B9D2-KO cells were estimated and expressed as scatter plots. Different colored dots represent three independent experiments, horizontal lines are means, and error bars are SD. Statistical significances among multiple cell lines were calculated using one-way ANOVA followed by the Dunnett multiple comparison test, and those between two groups (–SAG and +SAG) were calculated using the Student t test.

